Quantcast
Channel: DW on Sport
Viewing all 157 articles
Browse latest View live

Wimbledon Girls Preview

$
0
0
I wrote a preview for the French Open juniors that seemed to go down well, so I thought I would have another go for Wimbledon. Whoever wins the title will be looking at the success of the past two champions - Genie Bouchard and Belinda Bencic - and hoping to achieve the same in the coming years.
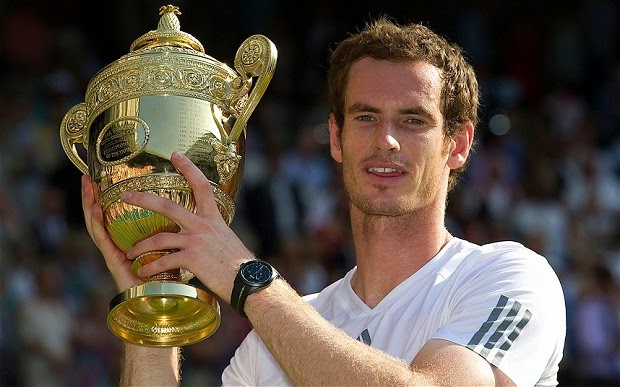
Belinda Bencic won the Wimbledon junior title in 2013

Quarter 1
Ivana Jorovic is the top seed for the girl's draw at Wimbledon, but to be honest, it is difficult to make a real argument for her being the most likely champion. Despite being the top ranked junior, she has never played a match on grass, either at senior or junior level, so to suggest that she stands a real chance of winning is tough. She has plenty of quality, which can get you a long way at this level, but there look to be players that are far more experienced on grass in this section that will cause her real problems. Her first match is against the American, Kaitlyn McCarthy, who is a former finalist of the International Grass Court Championships in the USA last summer. She should provide a real test of Jorovic's grass court credentials in the first round. Their second round opponent will be either Paula Badosa Gibert and Luisa Stefani, who are both are solid young players, but are inexperienced on grass.

Katherine Sebov is a Canadian qualifier, but do not let that fool you. She is a very good grass court player as she demonstrated in a run to the quarter-final in Roehampton, eventually losing to Kristina Schmiedlova. She was a break up in the deciding set of that match and could easily have beaten the Slovakian, who lost in the final. However, she comes up against another talented grass court player in Britain's Gabriella Taylor. Taylor scored the biggest win of her career in routing Sofia Arvidsson in qualifying for Wimbledon, although lost to Tereza Smitkova, but given her run in Wimbledon thus far, that is no disgrace.
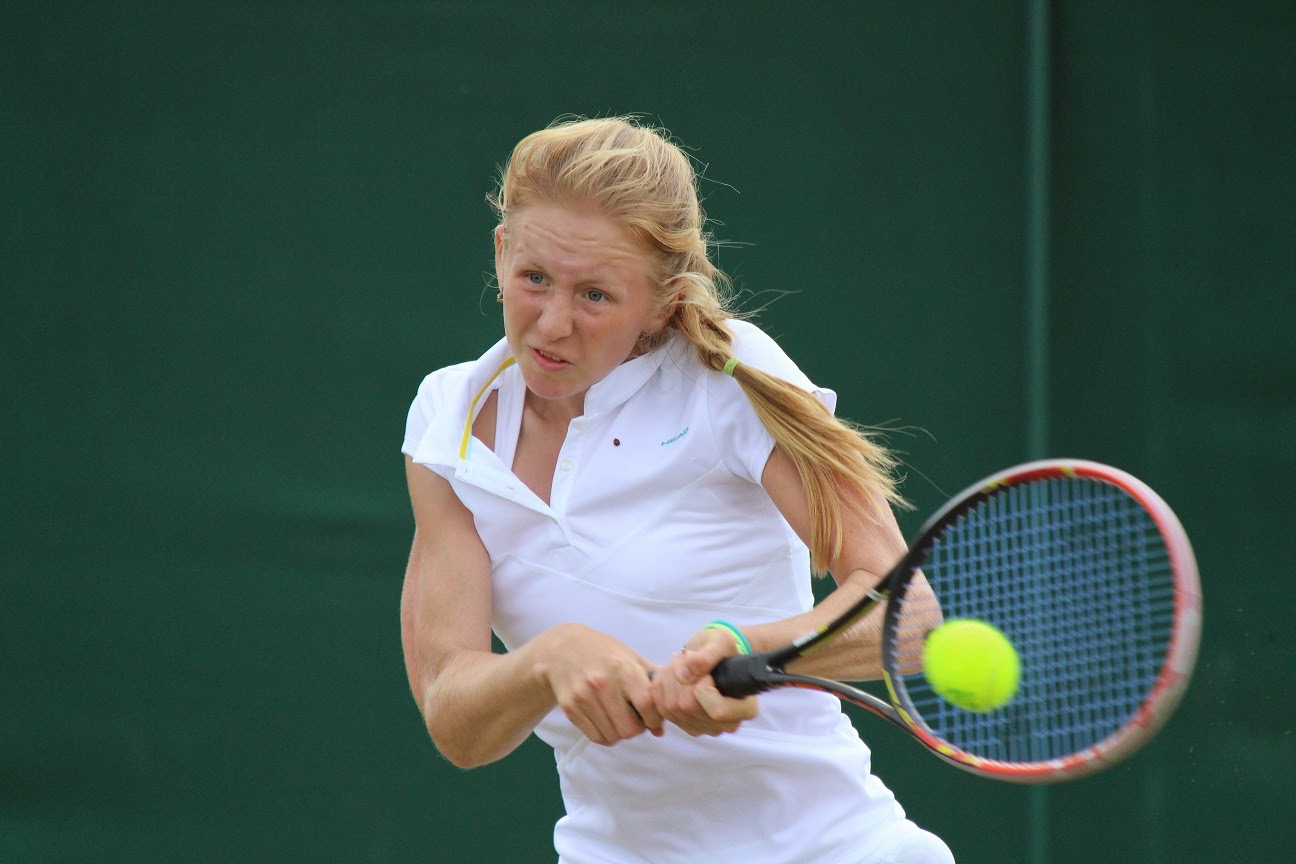
Katherine Sebov had a good run in Roehampton

The other two players in the top section - Tami Grende and Anna Bondar - are both yet to record their first wins on grass. Indeed, Anna Bondar is yet to play a match on grass. It is anyone's guess who might win this, but either player is likely to struggle against Sebov or Taylor in the second round.

The next section of the draw contains some very decent players. Marketa Vondrousova is just 14-years old, but was a revelation at the French Open, reaching the semi-final. She had a solid warm-up for Wimbledon with a couple of wins in Roehampton before losing in three sets to Britain's Katie Boulter. She plays Freya Christie, who gained plenty of grass court experience this week in Roehampton, reaching the third round of the singles and the semi-final of the doubles. She was unlucky in drawing Bencic and Townsend in the first round of Wimbledon and Roehampton last year and will be hoping to make the most of a slightly more fortuitous draw this time around. This should be an excellent first round match.

Viktoria Kuzmova seemed to enjoy her first experience of the grass in Roehampton as she beat a series of talented players in a run to the semi-final. She put up the biggest challenge against the eventual champion, Jelena Ostapenko, and she will go into Wimbledon with plenty of confidence. She should beat Katrine Isabel Steffensen without too many problems to set up a second round clash with either Christie or Vondrousova.
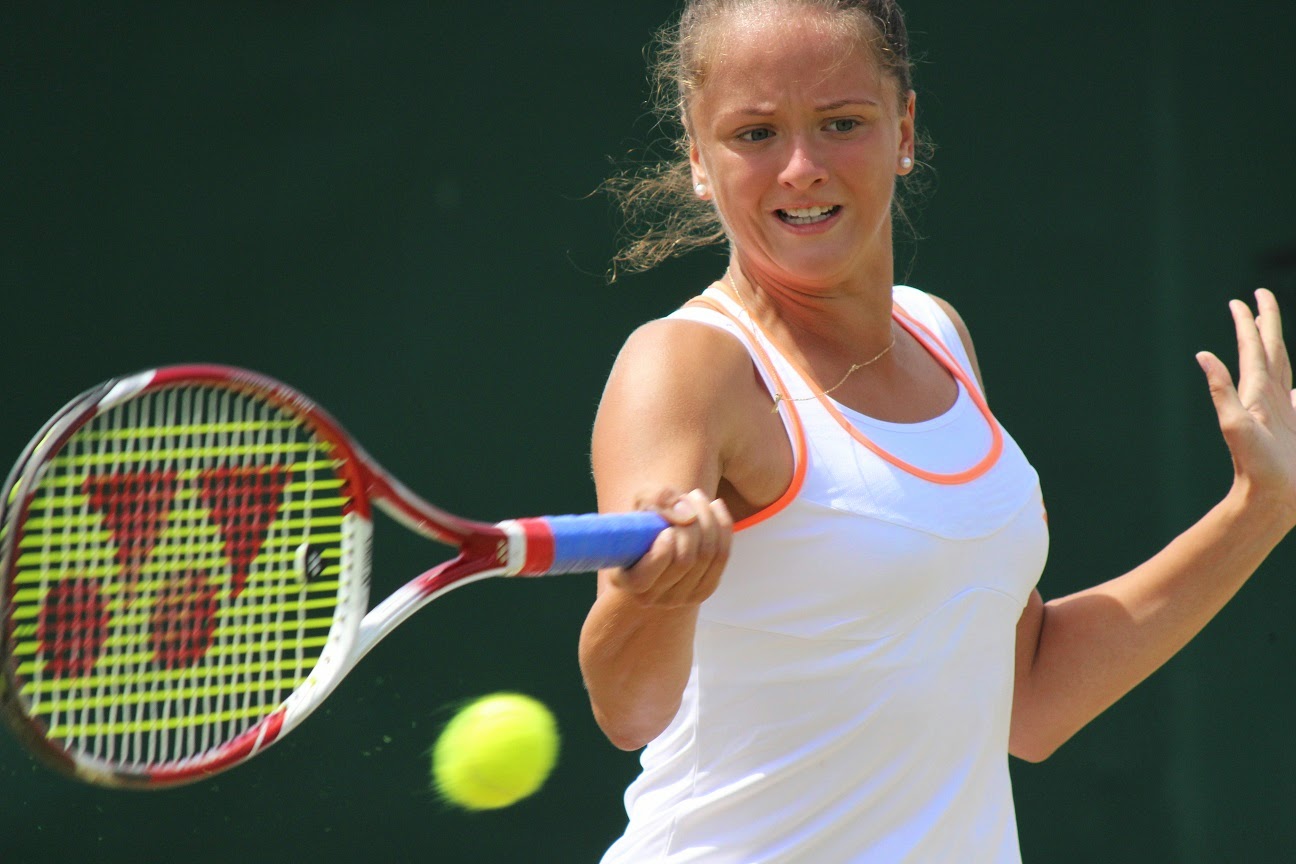
Viktoria Kuzmova was a semi-finalist at Roehampton this week

Neither Mendez or Hutchinson will have any real impact on the tournament, but it is the seventh seed that rounds out this quarter that could be a real threat. Two years ago, she reached the semi-final of both Wimbledon and Roehampton, where she beat the likes of Taylor Townsend and Donna Vekic. She has not really pushed on as expected and she has not played on grass since then, but if she clicks, she will be a real threat. She should cruise through the first two rounds and gain experience of playing on grass again, then it will take a good player to stop her.

Quarter 2
Tornado Alicia Black is the third seed, but she does not have a great deal of experience on grass. She had a decent win against Gabriella Taylor in Roehampton, but won just five games against Kuzmova in the second round. She has struggled a bit outside of the USA and although she is talented, it would be a surprise if she were to go all the way. She should get past Anna Brogan in the first round without too many problems though. Marie Bouzkova and Rebecca Sramkova are two good young players, but neither have shown any real interest in playing on grass thus far, so it would be a surprise were they to do much in this tournament.

Again, neither Yerolymos or Ogando have any obvious grass court potential, but the last match in this top part is probably the best match of the first round. Katie Boulter reached the quarter-final in Roehampton before running into an impressive Bellis, to back up some good performances on the senior tour, albeit not with the wins she might have hoped for. Her opponent is the Australian, Priscilla Hon, who lost to eventual finalist, Kristina Schmiedlova, in three sets in Roehampton and gained plenty of time on the grass in winning the doubles. In a relatively weak section, the winner of this could easily go through to the quarter-final.

The bottom half of this section is very strong. Anhelina Kalinina reached the quarter-final of Wimbledon last year as well as winning in Halle and had some decent time on court in reaching the quarter-final of singles and semi-final in doubles at Roehampton this week. Harriet Dart will not be an easy opponent though. She reached the semi-final in Roehampton last year and recorded wins against Ostapenko and Krejcikova, as well as running Ana Konjuh close. She has been gaining experience on the senior tour this season and this should be a fine match. The winner should come through their second round against either Dasha Ivanova or Qiu Yu Ye without too many issues.
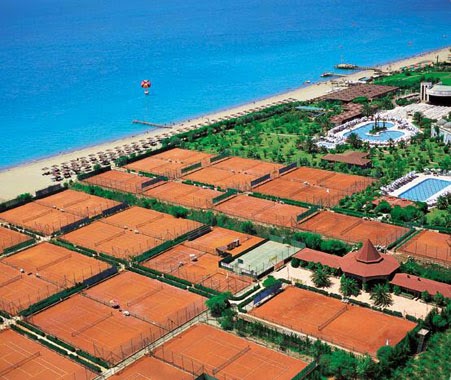
The Roehampton champion has often done well at Wimbledon. Ostapenko
will be hoping to continue this tradition

Jelena Ostapenko was a dominant winner in Roehampton this week, using her power to dominate opponents. She did not drop a single set and, in recent years, the Roehampton champion has done well at Wimbledon. She will have been disappointed at her first round defeat last year and is a serious contender for the title this time around. Her opponent is the 15-year old Brit, Anastasia Mikheeva, who put in some good performances at Roehampton this week, only losing to Kalinina on a third set tiebreak. She will certainly prove a tough opponent for Ostapenko, but the Latvian should come through unscathed. The winner will likely play last year's losing Wimbledon doubles finalist and Roehampton finalist, Iryna Shymanovich. She would have been disappointed with her performance in Roehampton this year, but she has grass court pedigree and a second round match against Ostapenko could be a really high quality affair.

Quarter 3
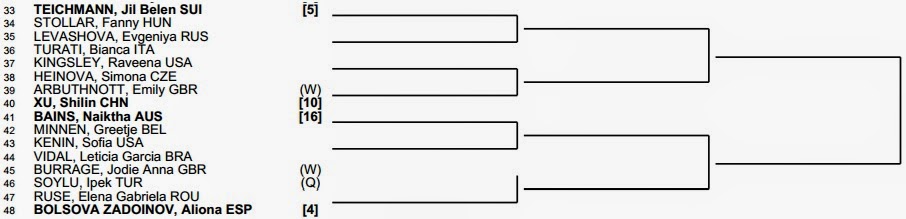
This is a relatively weak quarter of the draw. Jil Belen Teichmann is a very good young player on the clay, but has never played a match on grass, which suggests that she is not overly bothered about this surface. Similar to Jorovic in the top half, she is a talented player, which could get her through a few rounds, but it is unlikely that she will seriously challenge for the title. Her opponent is 15-year old Fanny Stollar, who has only played one tournament on grass, but did have a good win against Isabelle Wallace before losing to Kuzmova in the third round. There is every chance she could threaten Teichmann in this match.

Both Evgeniya Levashova and Bianca Turati have only ever played one tournament on grass. Levashova fell away quickly against Zarazua in the end last week and had a medical timeout for a leg problem in the deciding set, while Bianca Turati had a good start against Kalinina, but was outclassed in the end. My guess is that Turati will win this and anything could happen if she gets through in this weak section.
Fanny Stollar might fancy her chances in this relatively weak section

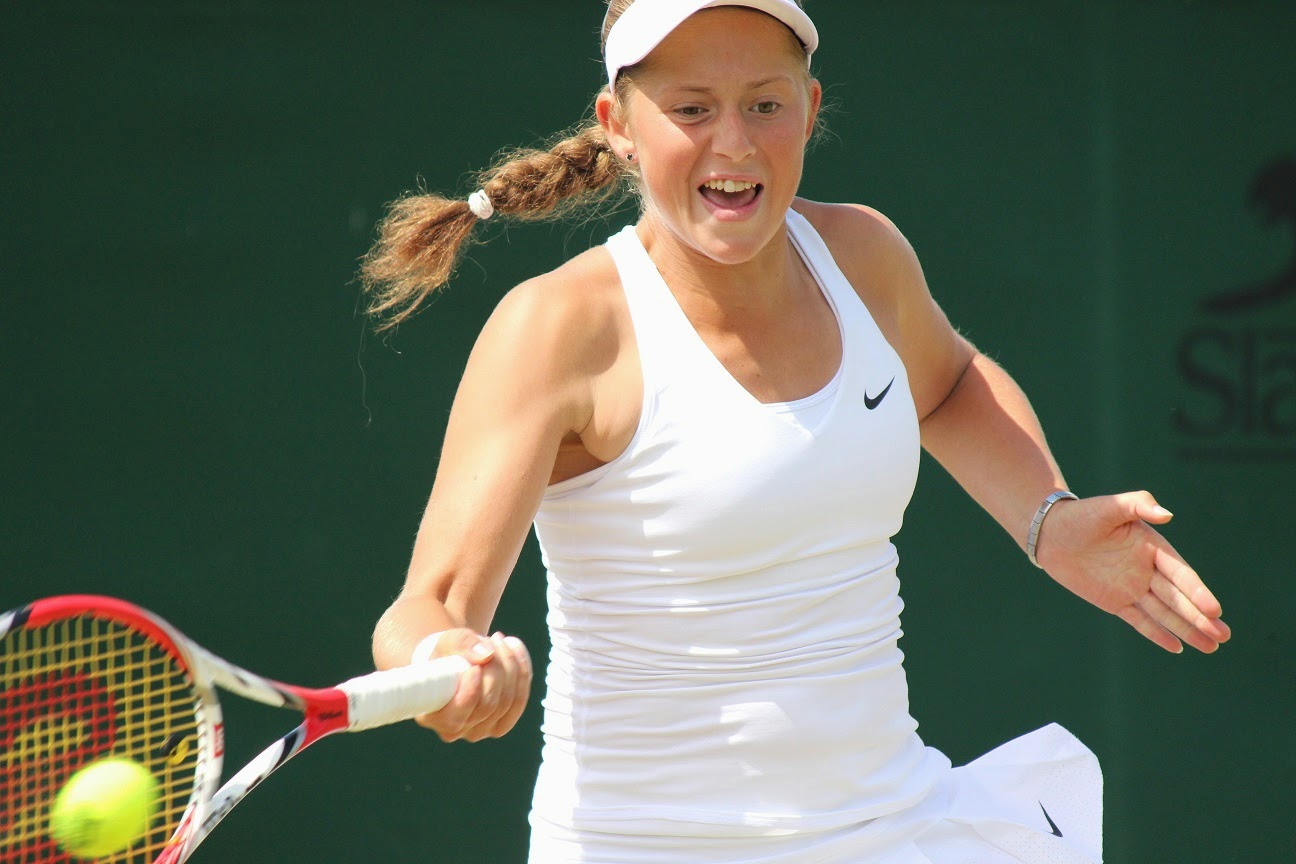
Raveena Kingsley fought hard and was fairly impressive in defeat in the first round against Vondrousova in Roehampton last week and will fancy her chances against Simona Heinova, who was another first round casualty last week, this time against Badosa Gibert. However, the player most likely to come through this section of the draw is the Chinese player, Shilin Xu. She reached the quarter-final in Roehampton before being blasted away by an inspired Ostapenko, but she has as much grass court experience as any player in this draw. I suspect she will fall short against the top juniors, but in this weak section, she should come through.

Naiktha Bains is seeded in the next section, although she has no particular grass court pedigree. She had a pair of wins in Roehampton, but lost against the first decent player that she came up against. Her opponent, Greetje Minnen was beaten in the second round of Wimbledon last year against Bencic, but is a decent player on grass. Neither will challenge late in this tournament, but it could be a close match. They are likely to play the American, Sofia Kenin, in the second round, who was unfortunate enough to draw Ostapenko in the first round in Roehampton. Despite a straight sets loss, she showed enough to suggest she is a decent grass court player.

The player that is most likely to progress from this section is the Turk, Ipek Soylu. She already has a pair of third round appearances at Wimbledon to her name and has plenty of experience on the grass. She would also have gained valuable big match experience from the wildcard that she received into qualifying at Miami earlier this year. She will not be troubled by Burrage in the first round.
Ipek Soylu is most likely to progress out of this section of the draw

Aliona Bolsova Zadoinov is the fourth seed, but again, is a high seed with very little experience or pedigree on grass. She reached the final in the doubles at Roehampton, which will have given her some practice on the surface after being hammered in the first round of the singles by Katherine Sebov. She should have enough against another inexperienced grass court player in Ruse in the first round, but I would be surprised if she comes past Soylu in the next round.

Quarter 4
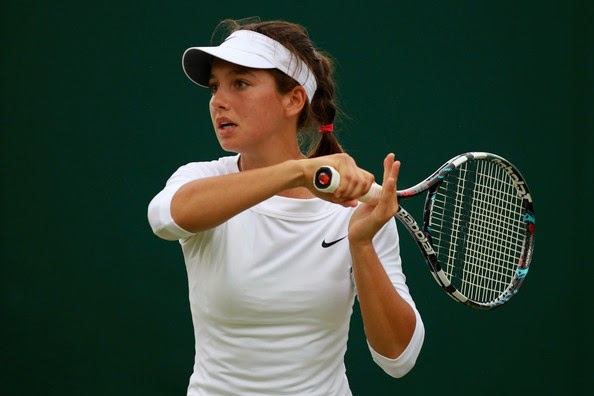
Kristina Schmiedlova is the first player in this section and will be full of confidence after a run to the final in Roehampton. It is the first time that she has really shown any form on grass and she will be hoping to carry this into Wimbledon. Her opponent, Usue Maitane Arconada, is not a bad grass court player by any means, having reached the final of the International Grass Court Championships in the USA in 2012, but if Schmiedlova plays as she did this week, it might be too big of a test for Arconada.

Neither Ploskina or Birrell have any obvious grass court pedigree, although Ploskina did push last year's semi-finalist, Louisa Chirico, to three sets in defeat in the first round. Birrell had a great run in Australia, but has never played a grass court match in her junior career.
Kristina Schmiedlova will be hoping to carry her good form into Wimbledon

Renata Zarazua battled well against an ailing Levashova last week in Roehampton after being outhit in the opening set. She came back well and backed it up with a win over Wargnier before falling to Bellis in the third round. Her opponent, Justina Mikulskyte, has played a few matches on grass before, but has struggled against some very average opponents, so I would be surprised if she is good enough to beat Zarazua here. The winner of that match will play either Katie Swan or Ioana Loredana Rosca. Swan is listed as British, but has spent most of her time in the USA and is expected to switch nationality in the future. Despite this, she will get some home support, but against a player that has won a couple of matches at Wimbledon in the past, this might not quite be enough. Rosca should come through this, but is unlikely to really challenge later in the tournament.

Sandra Samir was a semi-finalist in Halle last year and lost to Townsend at Wimbledon, but has struggled a bit recently and has not played a warm-up match on the grass yet. Her opponent, Michaela Gordon, is just 14-years old and this is her first tournament on grass. She came through qualifying, so at least has some experience, but the Egyptian may well be too good in the end. She is likely to face Scotland's Isabelle Wallace in the second round. While Wallace is far from the best grass court player out there, she should have too much for Grabher in the first round, and could well challenge Samir in the second.
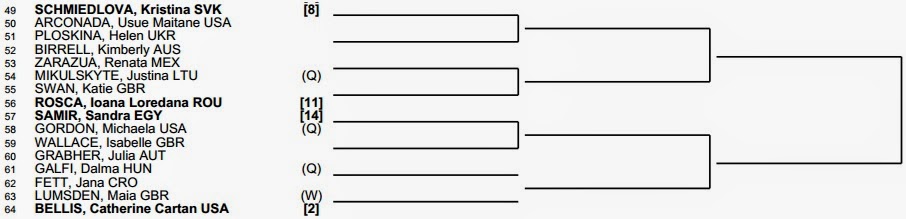
CiCi Bellis is one of the favourites for the title

Jana Fett should win against Dalma Galfi to set up a match against the second seed, CiCi Bellis. Bellis has been one of the form players in the juniors this year and would have been disappointed to lose in the semi-final in Roehampton. Despite the 6-4, 6-2 scoreline against Schmiedlova, there was very little between the two players in the match. She won the International Grass Court Championships in the USA last year to show her grass court pedigree. She will certainly be one of the players to beat.

Predictions

Having run through most of the players in the draw, it is time for some predictions. As with any junior event, it can be fairly unpredictable, but here is my prediction:

Round 3

Ivana Jorovic v Katherine Sebov
Viktoria Kuzmova v Francoise Abanda
Tornado Alicia Black v Katie Boulter
Anhelina Kalinina v Jelena Ostapenko
Fanny Stollar v Shilin Xu
Sofia Kenin v Ipek Soylu
Kristina Schmiedlova v Renata Zarazua
Isabelle Wallace v Catherine Cartan Bellis

Quarter-Final

Katherine Sebov v Francoise Abanda
Katie Boulter v Jelena Ostapenko
Shilin Xu v Ipek Soylu
Kristina Schmiedlova v Catherine Cartan Bellis

Semi-Final

Francoise Abanda v Jelena Ostapenko
Ipek Soylu v Catherine Cartan Bellis

Final

Jelena Ostapenko v Catherine Cartan Bellis

Competitive Balance in the Premier League

$
0
0
‘Among us, no one shall be the best; but if someone is, then let him be elsewhere and among others. Why should one be the best? Because then the contest would come to an end and the eternal life for the Hellenic state would be endangered’

This quote shows that competitive balance has been crucial for 2,500 years. Made following the ostracism of Hermodorus, it describes how ancient Ephresians exiled any competitor in a contest who they felt was too dominant, preserving interest in the contest.

The issue of competitive balance has often been brought up with regards to the Premier League. The money involved, particularly through participation in the Champions League, has been accused of making the Premier League relatively uncompetitive, and as a result, slightly boring at times. The same teams tend to dominate at the top of the league and the same teams struggle season after season to hang onto their treasured place in the division.
Fans always hope their team can progress up the league - uncertainty as to
results is the driving interest in sport

So, has the competitive nature of the Premier League declined since its inception due to the growing gap between itself and the Championship? Has it declined within the league as the Champions League clubs move ahead into their own virtual mini-league?

First of all, let us clarify what we mean by competitive balance. If there is considerable uncertainty concerning the outcome of a sporting contest or league competition, we would say there is high competitive balance. It is a relative measure of sporting abilities across teams in competitions.

There are two types of competitive balance. Static competitive balance looks at within-season competitive nature of a league. It focuses on whether sides are evenly matched, leading to closely-fought tournaments or whether there are large differences, leading to runaway leaders and sides adrift at the bottom. Dynamic competitive balance looks at competition over longer periods, focussing on whether sides consistently occupy the same positions in the league.

So, how can we measure competitive balance? We shall borrow two methods from economics – the Null-Scully value and the Spearman Rank Coefficient.

The Noll-Scully measure compares the standard deviations of winning percentages in the league with the standard deviations we would expect in a perfectly competitive league, where every side has a 50% chance of defeating any other side. We then derive the Noll-Scully value using the formula:
where σ(wp)ideal is equal to 0.5/√N. σ(wp)it represents the standard deviation of winning percentages within league i during period t, and N represents the number of games. The standard deviation of an ideal season takes this form because the standard deviation of a random selection of an individual team’s wins follows a binomial distribution (N,p) where N is the number of games played and p is the probability of winning. In a perfectly competitive league, p would be 0.5; hence we get the expression for the standard deviation in a perfectly competitive league.

In a perfectly competitive league, the Noll-Scully value would be one, since the two standard deviations would be equal. This value must always be greater than one, since the standard deviation in any competition cannot be lower than that in a perfectly competitive league. The closer to one, the more competitive the league.

The measure for dynamic competitive balance is the Spearman rank correlation coefficient. This looks at correlation between finishing positions of clubs in consecutive seasons. In a perfectly competitive league, there should be no correlation between where clubs finish in one season and where they finish in the following season. As the league gets less competitive, the Spearman value moves further from zero, either positively or negatively. In many cases, teams that do well in one season do better the following season, so we would expect it to become more positive.

To calculate the Spearman coefficient, we must rank the teams. Fortunately, the structure of league competitions does this. The team that finishes top has a ranking of 1; the second-placed team has 2, and so on. We then use the formula:
where di is the difference in rank for team i between the current season and the previous season, and n is the number of teams. In a perfectly uncompetitive league, every side will finish in the same position as the previous year, d will equal zero, and therefore the Spearman’s coefficient will be 1. As it becomes more competitive, this moves toward zero.

Obviously, the Premier League has a relegation system, where the bottom three clubs are demoted to the Championship, while three teams are promoted into the league to take their place. To deal with this across seasons, the team that wins the Championship will be treated as equal to the team that finished 18th in the Premier League, the team that finished 2nd would correspond to the Premier League's 19th placed team, while the Playoff winner will correspond to the bottom team in the Premier League.

Now that we have established our two measures, let us look at how they have changed over the past 22 years since the Premier League began. The first chart below shows the Noll-Scully values:
As I stated earlier, a perfectly competitive league would have a Noll-Scully value of 0.5. Clearly the Premier League is far from a perfectly competitive league, but every league in every sport in the world has certainly levels of imbalance.

However, we can see a steady upward trend in the Noll-Scully value since the inception of the Premier League in 1992. The first season saw a N-S value of 1.04, but ever since then, it has followed a relatively constant increase with the exception of the 2010/11 season, which saw a surprisingly low value.

So, the 2013/14 season that recently finished saw a N-S value of 1.99, but how does this compare with other competitions? In the National Hockey League (NHL) in America, the average N-S value during the 2000s was 1.73. For the National Football League (NFL), we find a value of 1.57, while the National Basketball Association (NBA), the value is just below 3.0.

We can conclude that the English Premier League has a greater static competitive balance than the NBA, but less than both the NHL and NFL. The concern might be the trend in the static competitive balance though.

How does the Premier League perform on dynamic competitive balance? The chart below shows the Spearman rank coefficient:
As stated earlier, a perfectly dynamically competitive league would have a Spearman value of 0. A perfectly uncompetitive league where every team always finishes in the same position would have a value of 1.

We can see that the Spearman coefficient dramatically increased in the years immediately following the inception of the Premier League. The drop following the 1999/2000 season marks the point where the number of English teams in the Champions League increased from two to three, then four. There was slightly more competition around this period as additional teams gained the opportunity to benefit from the riches of the Champions League, but once the Big 4 teams were established, the Spearman coefficient returned to its upward trajectory.

It is too soon to draw any clear conclusions, but the drop in the Spearman coefficient this season might be linked to the increased television money in the Premier League increasing competitive balance within the league as other teams can afford transfer fees to bring in new stars, but it could just as easily be dominated by the effect of Manchester United dropping from 1st to 7th following the departure of Sir Alex Ferguson and Liverpool's unexpected title challenge. The coming seasons should help us to understand this more.

Again, how does this compare with other competitions? In the NHL, the Spearman value tends to fluctuate between 0.4 and 0.6, in the NFL, it is between 0.2 and 0.3 and in the NBA, it is around 0.6.
The NFL is one of the most competitive competitions in global sport

Thus, the Premier League has incredibly high levels of dynamic competitive imbalance. Teams tend to finish in the same position from season-to-season with very little real change. There may be some variety in terms of how far apart all the teams in the division are, but in terms of where they actually finish, there is very little difference.

This roughly corresponds with what we expected to find. The top teams are financially far superior to the rest of the league, meaning that they rarely drop out of the top grouping. Even within that top group, there is a fairly strong pecking order. For the majority of recent seasons, Manchester City, Manchester United and Chelsea have battled for the title. Arsenal have finished 4th, while Tottenham, Liverpool and Everton battle it out for the 5th-7th placings.

The growing gap financially between the Premier League and the Championship means that teams often struggle when they come into the league, while the same group of teams tend to either just stay up or finish in a comfortable mid-table position come the end of the season.

This is where the Premier League may struggle in the future. The steady rise in the Noll-Scully value shows that the gap between the top and bottom of the league is growing almost year-on-year, which combined with the Spearman coefficient, means that the league is becoming more and more hierarchical. If this continues, people will start to lose interest in the league. Fans always maintain that hope that their club can break into the higher levels over time. If this hope is diminished, the interest in watching the sport might begin to decline.
Michel Platini's FFP regulations will have a negative impact on competitive balance

Is there hope that things might change? Sadly, it would appear not. The new UEFA Financial Fair Play regulations will act to reduce competitive balance further by artificially imposing different budgets on teams. The top teams already have greater revenues, so they can spend more money. Smaller clubs will no longer be able to speculate to accumulate.

Without more considered interference from either the Premier League or from UEFA, it is tough to see how these trends can be halted or even reversed. The financial aspect of football means that the top clubs get richer and richer at a far higher rate than the rest of the league. Thus, it is likely that competitive balance will continue to fall over the coming years.

Junior Tennis Review - 16/02

$
0
0
Paula Badosa Gibert won the Mediterranee
Avenir Grade 1 event in Morocco
Mediterranee Avenir (Morocco) – Grade 1

A huge shock in this Grade 1 event as unseeded Spaniard, Paula Badosa Gibert, came through qualifying to go all the way to the title without dropping a set. Seven straight sets victories will catapult her from 535 in the junior rankings to the verge of the top 150. She beat three of the top 8 seeds in the tournament, capping it with a win over the very talented Sandra Samir in the final. Top seed, Ioana Ducu, was beaten in the third round by Canada’s Marie-Alexandre Leduc. The doubles ended in a walkover in the final as the team of Anna Bondar and Ioana Ducu pulled out, gifting the title to Viktoria Kuzmova and Kristina Schmiedlova.

Condor de Plata (Bolivia) – Grade 2

Raquel Pedraza made up for last week's disappointment as she lifted her first junior title. The 16-year old American beat her compatriot, Gabrielle Faith Andrews, in straight sets in the final to cap off a successful week, where she dropped just the single set. There was home joy in the doubles, as Bolivia's Daniela Ruiz teamed up with Paraguayan Gabriela Ferrerira Sanabria to defeat second seeds, Nicole Frenkel and Ellyse Hamlin in a third set tiebreak.

Trofeul D.Sturdza (Moldova) – Grade 2

In a tournament dominated by the Russians, it was 15-year old Daria Kruzhkova who lifted her first Grade 2 title and fourth junior title overall. The second seed did not drop a set throughout the tournament, beating unseeded compatriot Ksenia Stashenkova in the final. Stashenkova had progressed against the top seed, Anna Blinkova, in the semi-final when Blinkova retired after the first set. The injury that forced Blinkova out of the singles also caused her and Kruzkhova to forfeit the doubles final with the Romanian pair of Ioana Diana Pietroiu and Andrada Ioana Surdeanu benefiting.

NZ ITF Summer Championships 2014 (New Zealand) – Grade 3

13-year old, Destanee Aiava, improved to 16-2 for the year and extended her winning run to 10 matches as she destroyed the field at the NZ Summer Championships. Not only did she not drop a set, nobody got closer than 6-3 as she handed out five 6-1 sets on route to the title. Second seed, Claire Yonnkee Choi Spackman, was dispatched for the loss of just two games, while top seed, Madison Inglis, won just three games as the youngster obliterated the competition. Spackman would lift a trophy though as she won the doubles event with her partner, Rosie Cheng, who were awarded the title after the Hule sisters withdrew ahead of the final.

Copenhagen Winter Cup (Denmark) – Grade 4

The tournament had its dream final as the top two seeds faced off. Eventually, it would be the British top seed, Katie Swan, who would overcome the local favourite, Julie Noe, in a final set tiebreak. Neither players had dropped a set on their path to the final, but it was a tough battle to determine the champion. Swan would complete the pair as she lifted the doubles title with her partner, Claudia Wiktorin, as they beat Wilhelmina Palmer and Ida Seljevoll Skancke 12-10 in the third set tiebreak.

Queretaro Junior Cup (Mexico) – Grade 4

Costa Rica’s Ariana Rahmanparast won her first ever junior title, but had to do it the hard way as she battled through three back-to-back three set matches before top seed, Jenna Friedel, retired at 6-4, 2-1 down in the final. Despite that, there can be few arguments that she deserved the title, beating three of the top four seeds in the tournament. Sofia Wicker was the best hope for the home fans, but eventually succumbed to Jenna Friedel in the semi-finals. Rahmanparast nearly capped off the perfect week as she reached the final of the doubles with her partner Arisha Ladhani, but they were pipped at the post by the American duo of Hada Chang and Sydney Arnea Riley.

ITF 4 Indoor Almere 2014 (Netherlands) – Grade 4

There was British success in the Netherlands as Anastasia Mikheeva beat the home favourite, Liza Lebedzeva, to lift her second Grade 4 title of her career. The 14-year old dropped just the single set during her run to the title, that being in the semi-final against the eighth seed, Isolde de Jong. Having defeated three of the top eight seeds, Mikheeva can be pleased with her week. Lebedzeva made up for the disappointment of losing the singles final as she lifted the doubles title with her partner, Vinciane Remy, as their opponents withdrew ahead of the final.

6th Kenya International Junior Championships (Kenya) – Grade 5

The tournament saw a pair of first-time finalists as seventh seed, Jessica Crivelletto, took on British eighth seed, Katarina Weymouth. It would be the Swiss player that emerged victorious to lift her first ever junior title after a three set battle. There was disappointment for local hopeful, Kenya’s Stephanie Mbaya, who crashed in the second round, despite being seeded fourth for the tournament. However, Crivelletto was unable to win a second title as she lost in the doubles final with her partner Anita Ance Detlava as the unseeded Austrian pair of Antonia Paleczek and Victoria Walter won 11-9 in the third set tiebreak.

How To Fix a Tennis Match (by Boy Westerhof and Antal van der Duim)

$
0
0
Meerbusch is a small town in the west of Germany with a population of just over 50,000 residents. Since last year, it is also the host of the Maserati Challenger tennis tournament. As a tournament, they would have hoped to garner some attention, but they would never have expected to be the focus of attention of many hundreds of tennis fans on Twitter for around an hour and a half on Monday afternoon.

One would imagine that Boy Westerhof and Antal van der Duim also did not expect many people to be paying any attention to their match. The only one of the five singles matches being played today on a non-televised court, they would have expected nobody to be watching. Unfortunately for them, someone is always watching.

The match was first brought to my attention just after midday by Nick Spurett on Twitter, who had noticed that the price on Antal van der Duim had crashed in the preceding half hour.
Indeed, as we can see from Oddsportal, between 11:05 and 11:36, the price on Antal van der Duim on Pinnacle had collapsed from 2.70 into 1.83, at which point Pinnacle decided to suspend their market on the match. Marathon decided to keep their market open and we can see that their price was forced all the way into 1.20. A huge price move on any match. Checking Betfair, the price crash was quite clear.
Suspicious, but nothing particularly conclusive there. However, looking in slightly more depth revealed some more interesting observations. If we accept the Betfair price of 1.33 as being the correct price for the match, we would roughly expect van der Duim to be around 2.0-2.1 to win in straight sets and around 4.0 to win 2-1. Looking at the set betting for this match showed something far different.
The two correct scores for Antal van der Duim appear to be the wrong way around. For those that are unfamiliar with betting, the price of 1.95 on the van der Duim 2-1 scoreline equates to a probability of 51.3%. There is no possible situation where the price for a player to win 2-1 should be this short a price and certainly not based on the match prices.

The prices on Antal van der Duim and the 2-1 correct score continued to drop as the start of the match approached. Whether this was suspicious money or people simply following into the market on what they felt was a fixed match is not clear, but either way, the money kept coming.
There are several things to note here. The first is the amount of money matched on the markets. There is already over £40,000 match on the match winner market. No other match from Meerbusch had more than £5,000 matched at this point. As a comparison, tonight's match between Gilles Simon and Bernard Tomic, which is scheduled to start in just over three hours, currently has just under £20,000 matched on it.

As we can see, the odds on Antal van der Duim to win the match have not changed from the previous screenshot, but the price on the 2-1 scoreline has continued to crash, now trading at 1.58 or a 63.3% implied probability. Naturally, if the fix is for the 2-1 scoreline, the two players would have to split the first two sets to reach a deciding third set.

Based on the markets for the 1st Set Winner and the 2nd Set Winner, we can see what the script for the match is. Despite apparently having only a 25% chance of winning the match, Boy Westerhof is priced at having a 60.2% chance of winning the opening set. One might think this is rather peculiar. One would be correct. The favourite for the match should always be the favourite for the first set in the match.

The match started without too much incident. It was slightly peculiar that van der Duim shortened slightly after the first game where Boy Westerhof held serve, but it was only a small movement. The strange thing as the set progressed though was that whatever happened, the odds on the two players were stubbornly sticking at their pre-match level.

After nine consecutive holds, Antal van der Duim was serving to stay in the set at *4-5. If the script, as implied by the pre-match markets, was correct, he had to lose the opening set. He immediately dropped the opening three points of his service game to go *0-40 down. At this point, the market moved slightly.
Antal van der Duim's odds had drifted to 1.49 at this point. However, even if we did not change any of the pre-match service predictions, we would expect to see him around the 1.9-2.0 price if he were to lose the set. So, clearly he is still far too short. Despite winning two points, he dropped his serve and, with it, the first set. The market still had no worries about him coming back to win though.
In fact, his price had actually shortened again, despite losing the first set. At this point, the market is suggesting that he has a 71.9% chance of winning the match from a set down. Impressive given that he only had a 75.7% chance of winning the match at the start. In other words, losing the first set has made no difference to his chance of winning the match. It is almost as though someone knew what was going to happen.

Another easy hold at the start of the 2nd set for Boy Westerhof continued his excellent serving performance. He had dropped just six points in his first six service games. When he broke Antal van der Duim to make it *2-0 in the 2nd set, then held serve comfortably again, some might have thought that the fix was just a myth. Given the starting prices, Westerhof should have been priced around 1.40 at the biggest at this point. However, this was not quite the case.
Despite being 6-4, 3-0* down against a player ranked higher than himself, who had been serving excellently all match, it was still priced at van der Duim having a 64.1% chance of winning the match. In other words, despite being 3-0* down in the set, the chances of a van der Duim win had dropped just 7.8%. Frankly, this is just wrong - it would be very rare, even in a match involving the likes of Djokovic or Nadal against much lower ranked opposition, for a player to be this short a price at a set and a break down.

In his next service game, van der Duim was able to hold serve and get himself on the scoreboard in the 2nd set. At this point, the odds for the winner of the second set were rather interesting.
Despite being *3-1 up with a break of serve in the set, Boy Westerhof was priced at just 33.3% to win the set. Amazingly, Antal van der Duim was significantly shorter down a break in the set than he was before the match.

Boy Westerhof would not win another game in the set. From *30-30 in his next service game, his game would seemingly disintegrate. Van der Duim would break back, convincing the market that there was no concern.
Indeed, with the break back to make it 3-2*, Antal van der Duim would hit his lowest price to date at 1.21. His price would never look back. A hold of serve to make it 3-3 and the market was entirely convinced where this match was heading. When Westerhof was broken for a second consecutive game, the market was done.
After a run of 14 consecutive points, Westerhof finally won a point, but another break of serve and the second set was van der Duim's.
At the end of the second set, one might have expected to see the prices similar to those at the start of the match, probably with the favourite being slightly bigger, reflecting the fact that the match had become a one-set shootout.

One probably wouldn't have expected Antal van der Duim to have a 97.1% chance of winning the match. Except that everyone following the match did. Seven straight holds to 4-3* followed before the coup de grâce from van der Duim. A break to 30 and he would have the chance to serve for the match and to complete the fix.
Despite tempting people with a couple of break points, he eventually closed out the match. By this point, close to half a million pounds had been matched on the match market - well over twenty times the amount that would normally have been traded on this match.

As the initial markets had implied, Boy Westerhof would win the opening set of the match, then Antal van der Duim would launch a comeback to win the match in three sets. People would have looked at the 3-6, 6-4, 6-4 scoreline and not seen anything untoward. If the peculiarities had not been noticed before the match started, it may well have gone unnoticed for the whole match. It was an non-televised match from an obscure Challenger event in Germany - why would anyone be paying attention? Well, plenty of Twitter tennis fans had taken notice and had figured out precisely what had happened.


It is not the first time that either of these players have been involved in suspicious looking matches and it is time that the ATP, the ITF and the TIU started to do something about it. I have no doubt that this match was fixed by both players, who are close friends. Indeed, they are playing doubles together in this tournament. By losing in the first round, Boy Westerhof picked up a cheque for around $500. If Antal van der Duim loses in the next round against the top seed, Albert Ramos, he will collect around $800. By colluding on this match, they could have potentially picked up a windfall that would dwarf that prize money.

However, the chances are that nothing will be done and Challenger players will see that they can fix matches like this without punishment. I cannot prove 100% that this match was fixed - maybe the authorities could or maybe their tracks will be well-covered. However, based on the betting markets, there is little doubt for the vast majority of people that followed the match that it was blatantly and disgracefully fixed.

Only four players have ever been banned for life for fixing tennis matches - Daniel Koellerer, David Savic, Sergei Krotiouk and Andrey Kumantsov. They are clearly not the only three players involved in fixing in tennis. If the authorities do not even look into this match and take action, they are virtually giving players carte blanche to fix whatever matches and scorelines they fancy to supplement their income.

If no action or investigation is launched, many fans will lose what little faith remains in the authorities to combat the growing spectre of match-fixing in the sport. For the ATP and the TIU, the ball is now in their court. Do they have a response?

UPDATE

I have just been sent a link to an interview with Antal van der Duim after the match in a Dutch newspaper regarding the suspicions surrounding his match. He explains:
We play against each other so often. We haven't been approached before the game. Do I understand the accusations? People on twitter say so much, mainly cursing. Gamblers are frustrated losing money. I play to get higher on the ranking charts, not to make money. I haven't been on the challenger circuit that long. *
I do agree that far too many matches are called out as fixes on Twitter by gamblers that have lost money on matches that they felt was a certain thing. However, I do feel that in this case, the accusations are far more than the normal angry gamblers. Many people, including myself, that have not had any money on this match have flagged it up and the market movements were hugely suspicious. Was it fixed? I believe so, but it is up to the authorities to investigate it properly and make the final decision.

*Thanks to Michiel Jongsma (@JongsmaJongsma) for the translation

UPDATE 2

There are some comments from the Dutch tennis association in an article here where they state that:
"It is often very annoying for those guys, who are conscious of no harm. Their phones are buzzing now. We try to support the boys in their communication."
Regarding the investigation by the TIU, to whom the match has been reported by several sources, including the Dutch tennis association, they explain that:
"There may be days or weeks over it. They have a standard where they include analyzing betting patterns, but also to interview them." *
For now, the match has been reported to the TIU, which is as far as we can take it. From here, we are unlikely to hear anything, given that the TIU are notoriously secretive and only ever issue press releases announcing 'the outcome of an investigation that results in disciplinary action being taken.'

So, we may read a brief press release at some stage in the future, but the chances are that this is the last we will hear on this match. Fingers crossed that it is not, but as with many fans, there is little faith in the TIU given a seeming lack of any progress in the past few years.

* Thanks to DutchTennis (@DutchTennisTips) for the translation

What Happens In Tampere...

$
0
0
Ask most people where Tampere is, the majority of people might struggle. Despite being Finland's third biggest city, it is not a place that is well-known beyond the borders of the Scandinavian country. However, three years ago, Tampere United were ejected from the Finnish league after they were connected with strange payments from Singapore. Fixing and fraud in sport has become intricately linked with the city's name.

Three weeks ago, the city hosted a Challenger tennis tournament. David Goffin would win the Tampere Open to wrap up his third consecutive title, but my interest in the tournament was piqued earlier this week by a response on Twitter to my article on the Boy Westerhof against Antal van der Duim match.
It made me wonder whether anything might show up to support this claim if I looked back at the tournament through the Betfair data. Going into this research with no preconceived ideas or suspicions, I was quite interested to see what the data might show.

Once I had extracted the relevant data from the huge file that Betfair provides, the first step was to look at the total amount staked on the first round matches.
The table shows the sixteen first round matches with the total number of bets placed on each match and the total amount matched on the four markets for each match. All the data is for pre-match only.

The average amount matched across the sixteen matches was £3,723, but if the top two matches are excluded, this average drops to just £1,186. The top two matches - Damir Dzumhur against Herkko Pollanen and Antal van der Duim against Elias Ymer - both saw amounts significantly above the average matched. The van der Duim against Ymer match in particular is interesting, given the 623 matched bets - almost five times more than the next most bet on match.
The next thing that I took a look at was the first matched and the last matched pre-match prices for each of the sixteen first round matches. A couple of matches catch the eye here. We can see that there was an enormous pre-match move on the van der Duim against Ymer match. Elias Ymer was first matched at 1.69 with van der Duim being matched at 2.5. By the time the match started, we can see that the price on Ymer has collapsed to the point where the final matched bet was at just 1.14.

Another match that saw a huge price move was that between Boy Westerhof and Pedja Krstin. Krstin was first matched at 1.73 and Westerhof at 2.42, but by the time the match started, Krstin's price had collapsed in just 1.25 with the Dutchman having drifted significantly out to 3.4. Several other matches saw big moves as well. In both the Kontinen against Giner match and the Pavlasek against Zopp match, we saw a switch in favourite, while Niels Desein drifted significantly having started as a very strong favourite.

As an aside, it is slightly sad to note that not a single bet was matched on Maxime Teixeira to beat Jordi Samper-Montana in his first round match.

It is important to remember thought that a big move in price does not necessarily signify anything untoward. It could simply be that the initial prices were incorrect. However, it is something that we may wish to bear in mind.
We can continue to drill down into the Betfair data and break down the overall matched amounts by the market that it was matched on. Things become quite interesting here.

As we might expect, the majority of matches see the most money matched on the match winner market. However, one match stands out in this respect - the match between Boy Westerhof and Pedja Krstin. Here, we saw £986.20 matched on the Match Winner market, but a huge £2,540.02 matched on the Set Correct Score market. Interestingly, every penny of this was matched on the Krstin 2-0 scoreline, which was backed in from 2.14 into 1.71, mirroring the move in the match price.

The other match that saw a significant amount matched on the Set Correct Score market was the Antal van der Duim against Elias Ymer match, which saw no fewer than 67 bets on the market and a total of £3,243.98 matched. Of this, just £10.06 was matched on any result other than the Ymer 2-0, which was backed in from 2.16 into 1.3 before the start of the match, again mirroring the dramatic move in the match prices.

The other intriguing markets were the Set 1 and the Set 2 Winner markets in the Antal van der Duim against Elias Ymer match. The other fifteen first round matches saw a total of 38 bets on the Set 1 Winner market compared to 99 for this match, and just 4 bets on the Set 2 Winner market compared to 33 for this match.
So, how do these matches fit in compared to the rest of the tournament? We find that the Antal van der Duim first round match was second on the list, seeing around £10,000 less matched than the tournament's most bet on match - the semi-final between Pedja Krstin and David Goffin. Looking slightly closer at the money in this match, we see the vast majority matched on David Goffin in the Match Winner market at odds between 1.09 and 1.13.

Having seen where the money went and which markets saw the big gambles, how did these market movers perform?
The big movers in the market were successful. Elias Ymer and the 2-0 correct scoreline comfortably won with van der Duim winning just two games in the match. Similarly, Pedja Krstin and the 2-0 correct scoreline also won comfortably with the Serbian dropping just five games. Micke Kontinen won in a tough three set match after his move into favouritism, while Jurgen Zopp was unable to justify the market faith in him as he lost in straight sets to Adam Pavlasek. Niels Desein lost in three sets to Henrik Sillanpaa after his drift, while Maxime Teixeira actually won, despite not a penny being matched on him before the start.

So, we return to our initial question of whether there was any suspicion surrounding any matches during this tournament. The amount of money matched and quantity of bets on the Antal van der Duim against Elias Ymer match, particularly on all four of the side markets is unusual. There could be question marks around the amount matched on the Set Correct Score market in the Boy Westerhof against Pedja Krstin match.

However, this is not aimed at singling out those players. There was almost £2,400 staked on the Set 1 and Set 2 Winner markets in the Pedja Krstin against Ruben Ramirez Hidalgo quarter-final match. There was over £1,300 matched on the Set Correct Score market in the Micke Kontinen against David Goffin second round match.

Simply because there is plenty of money matched on a side market does not immediately mean there is anything suspicious. It could simply be that someone has a strong feeling on that match. It could be that a big-money punter merely fancies getting involved. However, given the recent events, it is worth bearing in mind that there could be something more sinister behind this money.

Are those matches 'dodgy'? We cannot conclusively say that they are. However, given the unusual betting patterns on these matches, particularly compared to the rest of the first round matches, we cannot conclusively say that there is nothing suspicious about these matches.

An Analysis of Drug Testing in Tennis

$
0
0
As Marin Cilic lifted the US Open title two weeks ago, it capped a remarkable turnaround in fortunes for the Croatian. Just fifteen months ago, he had withdrawn from Wimbledon through injury, although it later emerged that this was a cover for a failed drugs test in Munich earlier in the year. Cilic had tested positive for nikethamide, which appears on the WADA list of prohibited substances. After being given a nine month ban, he appealed to CAS, blaming his mother for buying the wrong glucose tablets, who then reduced the ban to four months.

Along with the Viktor Troicki case, where he was banned for 18 months, reduced to twelve, for refusing to take a blood test, which he blames on confusing instruction from the tester, it raised questions about drug testing in tennis and whether it matches up to, not only what fans of the sport might expect, but also to the levels of testing in other sports.

Before we delve deep down into the figures, we can look at the headlines numbers. In 2013, WADA-accredited laboratories tested 4,154 samples in tennis, spread across a number of different types of tests. This compared with 3,990 samples in 2012 – an increase in tests of 4.1%. In terms of the percentage of all of the basic samples tested across every Olympic sport, tennis represents just 1.97%.

Of these 4,154 samples, there were 15 that returned atypical findings and 14 that returned adverse analytical findings. Combining those, we find that 0.70% of samples returned either atypical or adverse analytical findings.

So, we have those headlines figures, but without comparison figures for other sports, they do not tell us a great deal. Taking the figures for 14 other sports, we can compile the following pie chart, representing the total number of samples taken in each of these sports.
As we can see, of these 15 Olympic sports, tennis does not come out looking particularly impressive. As a sport, there were fewer samples collected than there were in judo, triathlon and skating among others. Indeed, the only sports that collected fewer samples than tennis were handball, ice-hockey and boxing.

Football, as expected due to the sheer number of participants, shows up highly, but it is noticeable that cycling and athletics both conduct a very high number of tests. They are sports that have caught out major participants in recent years – Alberto Contador in cycling and Asafa Powell, Tyson Gay, Justin Gatlin and many others in athletics. Is doping more prevalent in those sports or does the fact that they conduct so many more tests simply mean that they do better at detecting dopers?

Now we have seen that tennis does not necessarily show up particularly well on these figures, let us delve more deeply into the type of tests that are conduct in both tennis and in our other 14 comparison sports.

Of the 4,154 samples collected in 2013, we see that 67.9% of those were basic urine tests, 15.8% were blood tests, 3.4% were GC/C/IRMS tests, 3.9% were EPO tests and 9.0% were HBOC and HBT tests. To explain these in slightly more detail, the urine and blood tests are fairly self-explanatory.

The GC/C/IRMS test stands for gas chromatograph/carbon/isotope ratio mass spectrometer tests and can be used to ascertain the relative ratios of certain isotopes of elements in compounds. The ratio of these elements can vary based on certain biological processes and can be used to flag up any non-natural or adverse reactions to certain chemicals or medication that an athlete might have used.
Marin Cilic lifted the US Open a mere 15 months after testing positive for a banned substance

EPO is a form of blood doping that, among other effects, leads to increased hermatocrit, allowing for greater oxygen carrying capacity in the blood. HBOC is similar in that they are intra/inter-molecularly engineered human hemoglobins, optimised for oxygen delivery and longer intravascular circulation, while HBT stands for homologous blood transfusions, which increases the number of red blood cells, increasing your oxygen carrying capacity.

So how does this match up to other sports? In terms of the percentage and number of blood tests, tennis actually shows up very well. Out of our other comparison sports, the second highest percentage of blood tests is rugby with just 5.7%. In terms of the raw numbers, only football, athletics and cycling conducted more blood tests in 2013.

Naturally, this particularly high percentage of blood tests means that the percentage of urine tests is significantly below the other sports, but given that blood tests are generally viewed as more advanced and more likely to detect doping, this is no bad thing.

In terms of GC/C/IRMS tests, the 3.4% in tennis falls behind just ice hockey and boxing in our comparison sports, although the 3.9% of EPO tests lag significantly behind a number of other sports, including cycling, swimming, skiing, skating and triathlon, all of which have double figure percentages here. However, this could represent a difference in views between those sports and tennis as to what forms of doping might be most prevalent in their sports.

It was interesting that tennis did not conduct a single test for hGH (hGH isoform differential immunoassays) in 2013 – the only sport in our sample that did not use this form of testing. However, the 9.0% of HBOC and HBT tests dwarfs any other sport – boxing is the second highest percentage with just 2.3% - and the raw figures back this up with no other sport conducting more HBOC tests than tennis.

Now that we have broken the tests down into greater detail, how about comparing the ratios of in-competition testing and out-of-competition testing. Generally, out-of-competition testing is likely to detect the greatest number of dopers given that athletes would coordinate their doping to avoid testing positive during competitions. We only have to look at the micro-doping and strict doping schedules that Lance Armstrong and the US Postal Team followed to see that in-competition doping is not all that effective.

Of the 4,154 samples collected in 2013 for tennis, 73.2% of samples were collected in-competition compared to 26.8% collected out-of-competition. This compares to an average over all Olympic sports of 59.0% of in-competition samples and 59.4% across our sample of 15 sports.

Of our sample, only football (77.9%) collects more of its samples in-competition than tennis with sports such as cycling (62.1%), athletics (54.8%) and swimming (49.4%) all doing significantly more work in collecting out-of-competition samples.

Overall, there is a picture emerging that tennis could do far more in terms of structuring its drug testing to enhance their chances of catching dopers. How has it improved between 2012 and 2013 though?

As we saw earlier, there was an increase of 4.1% in terms of the overall number of samples collected in 2013 compared with 2012. If we look more closely at the breakdown, we find that the number of urine tests has actually significantly decreased between 2012 and 2013, falling by 15.8%. The big rise has come in the blood testing – in 2012, tennis collected just 166 blood samples, compared with 657 in 2013. This is an encouraging sign if tennis is starting to focus more on blood testing than urine testing. The raw numbers of urine tests still significantly outweigh those of blood tests, but it is certainly a move in the right direction.

Tennis has also decreased the number of EPO tests that it has conducted from 262 in 2012 to 160 in 2013 – a fall of 38.9%. It has also completed removed hGH testing, of which it collected 147 samples in 2012. Replacing these has been a 138% increase in GC/C/IRMS tests and a 6,150% increase in the number of HBOC and HBT tests.

Tennis will also point to the fact that it has introduced the blood passport system. However, this is still in its very early days. In 2012, there were 74 samples taken for the blood passport system, which rose to 301 in 2013. However, comparing this to the 5,202 blood passport samples taken in athletics and the 7,429 in cycling, it is clear that it still has a very long way to go before it can start to rival the versions in the leading sports.

While this all suggests that tennis is a long way from having a rigorous and reliable anti-doping testing system, there are certainly some positives. The move toward blood tests at the expense of urine tests is a step in the right direction. While blood tests are more expensive, they are a superior form of testing. This being a long-term move is reflected in the budget increase for anti-doping from the ITF announced in recent weeks from $2m in 2013 up to a projected $3.1m by 2016 – an increase of 55%.

However, despite this, some of the comments from leading figures at the ITF, their anti-doping department and leading players do raise concerns. One in particular from Stuart Miller, the head of the ITF anti-doping program raises a few questions:

“It may be that tennis is not conducive to EPO. Maybe tennis is not a sport that is driven by a need to maximise stamina, which is what EPO essentially does.”

In 2006, there were 114 samples collecting for testing for EPO. In 2013, this had risen to 160, having bottomed out at just 21 in 2009 and having peaked at 262 in 2012. Ignoring the fluctuations over the intervening period, the increase in EPO tests since 2006 has been just 40.4%.

A recent study suggested that only football players log more miles in competition than tennis players do. The average tennis player covers between three and five miles in a five-set match, which would suggest that stamina is very much a concern for professional tennis players.

Stuart Miller is head of the ITF anti-doping programme, but some of his
comments are relatively concerning

Frankly, if the head of the ITF anti-doping programme does not believe that maximising stamina is an important aspect of tennis, then one could argue that tennis has a serious problem. He is not alone though – plenty of people think that doping is likely to be less helpful in tennis than in other sports. They talk about the technical element of tennis being more important than the physical aspects. While there may be some truth to this, I think it was nicely summed up by ‘The Overrule’ on Twitter – ‘Can drugs make you hit better volleys? No. Can they help you rush to the net after five hours in order to make that volley you’ve been working on? Yes.’

Greater stamina will have multiple benefits – it will allow you to keep going longer, it will allow you to get into position better later in matches, it will even help the mental side of your game. To suggest that there are no benefits from maximising stamina in tennis is frankly ridiculous.

However, one of the biggest problems is that there is currently little incentive for the governing bodies in tennis to actually detect dopers, particularly at the top levels of the game.

One only needs to look at cycling and the reputation that the sport now has to see the damage that doping revelations can cause to a sport. Cycling undoubtedly did have a serious problem with doping in the past, but it is now arguably the sport that is leading the charge against illegal drugs – it conducts the greatest number of tests and it has the most advanced anti-doping systems. However, it is a sport that will probably forever be viewed with great scepticism because of its history with doping.

Tennis, as with many other sports, does not currently have this problem. It is yet to have one of its major stars fail a doping test or come under severe, well-reasoned suspicion. If one of tennis’ leading stars were to be revealed as a drugs cheat, would there be negative repercussions on the sport? Almost certainly. Would it potentially lose some of its sponsors, some of its negotiating power? Quite likely.

Based on this, there is an argument that until a sport develops a public problem with doping, it has little incentive to catch dopers itself. Particularly in a sport such as tennis where the governing body is also the same body that runs the anti-doping programme, there is a potential conflict of interest. Doping in cycling was only really exposed publically by excellent investigative work from journalist, unconnected to the UCI. Could it be that similar work could be the only way to expose any doping problem that might exist in tennis?

To conclude, are anti-doping testing and measures in tennis sufficient at the current moment? Probably not. Are they moving in the right direction? Certainly, over the past 12 months, there could well be an argument that they may well be. There has been a worrying lack of progress over the past decade, but there are small signs that things might be improving. Could more be done? Absolutely.

Andy Murray: What Has Gone Wrong in 2014?

$
0
0
Before his back surgery after the US Open last year, Andy Murray had become an undisputed member of the ‘Big 4’ in men’s tennis. Long grouped with Roger Federer, Rafael Nadal and Novak Djokovic, Andy Murray had finally started to justify his inclusion in that group. When he lifted the Wimbledon trophy and realised a lifelong ambition, it seemed to mark the start of a rise to potential superstardom.

He had reached at least the semi-final of nine of the preceding ten Grand Slams, had appeared in five finals and had won two Grand Slam titles. He had won the Olympic gold medal at Wimbledon the previous summer. At that moment, the idea that it would be 14 long months until Andy Murray would reach his next final at any level would have been laughable.

Can Andy Murray rediscover the form that saw him win Wimbledon last year?

His comeback has been slow – much slower than he might have hoped. His relationship with Ivan Lendl came to an end, with the Czech potentially anticipating that the path back to the top would be long and, potentially even, impossible. However, looking at his statistics, it is difficult to pinpoint what is different about Andy Murray since his comeback.

As a starting point, let us look at Andy Murray on hard courts – a surface that he has thrived on in the past. The table below shows various statistics comparing his performance in 2013, where he won a Masters series title in Miami, reached the final of the Australian Open and won the title in Brisbane, with his performance in 2014, where he has won just the one title in Shenzhen last week and failed to pass the quarter-finals in any Grand Slam or Masters event.

Statistic
2013
2014
1st Serve %
61.2%
59.7%
% Points Won on 1st Serve
74.1%
73.5%
% Non-Ace Points Won on 1st Serve
70.3%
69.7%
% Points Won on 2nd Serve
51.1%
52.8%
% Points Won on Return
47.1%
43.1%
Break Points Created/Game
0.71
0.71
Break Point Conversion Rate
112.5
111.3
Aces/Game
0.52
0.47
Double Faults/Game
0.21
0.21
Break Points Faced/Game
0.45
0.49
Break Point Save Rate
97.5
97.1

So, what can we see from these figures? His first serve percentage is slightly down this year, although he would appear not to have lost any speed on his serve – the average serve of his first and second serves this year are virtually identical to both 2012 and 2013. When he gets the first serve into play, he is winning slightly less, but it is only down by 0.6% - not a huge amount. His percentage of non-ace points won on first serve, which acts as a proxy of the quality of his ground game is down very slightly, but again not by a huge amount. In terms of the rest of the ATP, his 74.1% in 2013 put him at 28th, while he has dropped just two places in 2014 to 30th.

His second serve has always been an issue, but he is actually winning a greater percentage of points behind his second serve this year than he did last year. It is still slightly down from the 53.5% that he won in 2012, but this improvement is encouraging. His 52.8% puts him at number 18 in the ATP this year, up eight places from last year.

His return game is slightly more concerning, but also slightly puzzling. He is winning a huge 4% fewer points on return this year compared to last year, but interestingly, he is still creating the same number of break points per game. This is intriguing and something that we shall come back to later.

Both his break point conversion rate and break point save rates are very fractionally down, but not by any significant margin, suggesting that we cannot necessarily point to his performance on the important points as the difference. He is serving 0.05 fewer aces per game this year, but this is again pretty negligible, while his double faults per game is identical to 2013. He is facing slightly more break points per game, but again a small change.

So, how do these very small changes affect his performance when we scale them up to game level, rather than point level?

In 2013, Andy Murray held serve in 83.6% of his service games on hard courts and was able to break his opponent in 34.4% of return games. In comparison, this year, he has held serve in 82.2% of service games and has broken in 33.3% of return games.

Again, these appear to be very minimal changes. He holds serve in 1.4% fewer service games and breaks serve in 1.1% fewer return games. Can these seemingly small changes really cause such a big difference in his results?

Thanks to Dan Weston (@tennisratings), we can look in more detail at his performance during individual sets. The starred statistics are for all surfaces, rather than just hard court, but the overall trends should be similar. The table below shows some interesting statistics:

Statistic
2013
2014
*Early Games Hold %
84.8%
84.1%
*Late Games Hold %
84.5%
81.2%
*Early Games Break %
30.3%
36.9%
*Late Games Break %
34.7%
28.2%
*Lost Lead when Break Ahead
21.8%
23.7%
*Recovered Break Deficit
54.6%
35.4%
Set 1 Win %
77.4%
52.8%
Set 2 Win %
76.7%
80.6%
Set 3 Win %
76.5%
63.6%

There are a couple of things that immediately jump out from this table. The first and most obvious is the drop in recovered break deficit. This represents the percentage of times that a player breaks back and gets back on serve when down a break in a set. This is the first time that we have seen a huge change in a statistic – down 19.2%.

Despite the impression that Murray has thrown away matches from winning positions on far too many occasions in 2014, the percentage of times that he has been broken back when leading by a break is only fractionally higher than it was last year.

Another area that is interesting is how Murray’s game changes over the course of a set. The early games statistics refer to the opening two service games of the set for each player and we can see that while Murray’s serve has changed little here, he is actually breaking 6.6% more often at this early stage in sets.

Conversely, he appears to struggle slightly more at later moments in sets. He holds serve 3.3% less often this year compared with last year, but the big drop is in the number of games where he breaks late in sets, which is down by 6.5%.

How can we relate these statistics to what we might expect to see from Andy Murray? Well, it would seem to suggest that he actually comes out of the blocks more quickly in sets this year, but late in the sets, he is struggling to break serve. When we combine this with the fall in recovered break deficit, we can see that the big difference is that, where last year he would often either break to take the set or to get himself back into a set, this is not happening this year and players are serving out sets against him. Where he was able to battle to get back into sets last year and win tight sets, he is unable to do it this year.

We can also see that, despite starting well in sets, he is starting very slowly in matches as a whole. Where in 2013, he won 77.4% of opening sets, this has dropped to just 52.8% in 2014. Constantly, he is forcing himself to come back from losing the opening set and giving himself no room for error. His second set win percentage is slightly up, as we might expect given that he is dropping opening sets against weaker players and forcing himself to up his game, but his third set win percentage is down from 76.5% to 63.6% this year.

While the sample is relatively small, could we speculate that it is taking Murray time to get his back moving and, as a result, is struggling to get going in opening sets? Could we suggest that his fitness is not quite at the level that it was before, hence he is winning fewer matches in deciding sets?

We can combine some of these new statistics with what we found in some of the more basic ones. We noticed that, despite his points won on return being down, he is creating the same number of break points. However, these break points are not being created when he most needs them – when he is behind in a set.

To conclude, the major changes that we can find in Andy Murray’s statistics this year are his performance when he is behind in sets. He is serving just as well as last year, his return is very slightly down, but he is still creating break point opportunities and he is playing just as well on the break points. However, the big problem is that he is struggling to create and take these opportunities when he is behind in sets. He is creating and taking break point chances when the match is level and when he is ahead. However, if his opponent draws first blood, the ability to fight back into the set is not there this year.

This appears to be particularly problematic in the opening set. He is often coming out of the blocks relatively slowly in opening sets, going behind and then finds himself unable to get back into the set. It means that he is constantly having to go three sets to get back into matches, which against top 20 players is tough. Only once in his last nine matches against top 20 players has he dropped the opening set and come back to win. Fighting back from a set deficit against top players is incredibly difficult, so he simply cannot afford to keep starting so slowly.

Why he is finding it far tougher to come back from behind, we cannot tell from the statistics. Maybe it is mental – could it be that having achieved his dream of winning Wimbledon, the desire to fight for every point in every match has dwindled somewhat? Could it be that confidence is low after the injury layoff and his lack of titles and finals since his comeback? Could it simply be bad luck – when he has the opportunities to break back, his opponents are coming up with aces or huge winners which hit the line this year, whereas they might have just missed the line in the past?


Without having watched all of his matches this year, it is impossible to tell. There is almost certainly not one single reason. However, the encouraging news for Murray fans is that his game is not far off being back to where it was last year. He is still slightly off, but given a full and injury-free pre-season, it would be no surprise to see him back challenging again in Melbourne next January.

Understanding the Tennis Radars

$
0
0
Recently, you may have noticed some of the player radars that I have been posting on Twitter. They do seem to have garnered some interest, but there have been a number of questions about them, so I have put together a brief guide as to how they work, what we can learn from them and, just as importantly, their limitations.

The first thing to mention is that they do not really convey any new information. Rather, they are simply a way to try and generate an easy visualisation of statistics. Many people find looking at or reading numbers quite dull or find it difficult to read the significance into certain statistics. The radars are simply an attempt to make it easier to get an immediate impression of a player’s statistics in a more accessible manner. There is nothing new outside of the standard information that is relatively easily accessible on the internet.

Statistics and data in tennis are really quite poor compared to the majority of major sports. Compared to a similar sized sport, such as cricket, there is significantly less useful data out there. The availability and complexity of available cricket data is like a separate continent from tennis. Compared to football, which has undergone a revolution over the past few years in terms of availability and quantity of data, it is in a whole different world. Compared to the American sports, such as baseball, NFL and hockey, it is simply incomparable. The data available to analyse those sports is quite simply outstanding. It is equivalent to a separate galaxy.

So, how do the radars work? The statistics available on the radar may change over time as more data or new measures become available, but the overall theory behind them will remain the same. Including the inner circle and the outer edge, there are ten rings that make up the radar. The mid-point of each axis represents the ATP or WTA mean value for that particular statistic. So, the perfectly average ATP player will have a radar that joins up the midpoint of each axis.

The inner circle represents a value that is two standard deviations below the mean. Similarly, the outer edge of the radar represents a value that is two standard deviations above the mean. Getting slightly more complex, if we roughly assume that all the values in the sample follow a standard normal distribution, then 95.45% of all players will lie within two standard deviations above or below the mean on each statistic. Thus, if a player reaches the outer edge on a statistic, we can roughly suggest that he is within the top 2.2% in the ATP/WTA in that attribute. Similarly, if a player is within the inner circle, we can suggest that they are within the bottom 2.2% in that attribute.

So, that is roughly how the radar itself works. Now, we will look at each of the current attributes. Most of them are fairly self-explanatory, but one or two of them are slightly more unusual.

‘% Won on 1st Serve’ and ‘% Won on 2ndServe’ are fairly straightforward and simply represent the percentage of points won on each of the player’s two serves. Similarly, the ‘% Won on Return’ represents the percentage of points won on the opponent’s serve. Related to the serve, ‘Aces/Game’ and ‘DF/Game’ are both as they suggest – it is the expected number of aces and double faults per service game. Dividing through by the number of service games helps to negate the effect of having played lots of long matches, where one might expect a player to serve more aces than in a series of shorter matches. Similarly, BP Faced/Game and BP Created/Game are based around the same principle for break points faced on the player’s own serve and created on his opponent’s serve.

The two slightly more unusual statistics are the Break Point Save Rate and Break Point Conversion Rate. The BP Conversion Rate is calculated by dividing the % of break points won by the player's % won on return to determine whether he performs better or worse compared to an average point when he creates a break point on his opponent's serve. A value of 100 corresponds to performing exactly the same, whether it is break point or not, a value greater than 100 corresponds to performing better on break point than an average point and a value lower than 100 corresponds to under-performing on break point. In the same way, the BP Save Rate divides the % of break points saved on a player's serve by the % of points won on serve to determine whether he performs better when facing break point.

Now, let us look at a couple of standard shapes of radars. The first is the typical 'servebot', who has a huge serve, bangs down plenty of aces, but has very little on return. The example of this is Ivo Karlovic on grass - pretty much the definition of a typical 'servebot'. We can see plenty of area filled at the top and on the left-hand side where the serve statistics dominate, but very little on the right-hand side in the return and break point creation areas of the radar.
The second example is a player with a very weak serve, but whose return game is crucial to remaining competitive in matches. Here, we have a young Argentinean player - Diego Sebastian Schwartzman - on all surfaces. We can see the right-hand side of the radar is now dominant with high outcomes in the return and break point creation areas, while the top and left-hand side is virtually unfilled, illustrating the lack of ability of serve.
In reality, the vast majority of players will lie somewhere between the two extremes. It is also important to remember that different abilities can go into generating high statistics in certain areas - the top players are likely to generate high serving statistics, even if their serve is not that great, simply due to their superior ability in rallies.

So, the radars can give an idea of the style of game that certain players adopt and it can give us an idea of the overall quality of a player. Certain of the statistics are likely to be highly repeatable - a big server is likely to have high values for the first serve statistic, for aces and break points faced in each separate year, while top returners are likely to have high values in the return and break point creation. However, without further work, one can only speculate as to whether break point conversion and save rates are repeatable across years.

Serena Williams: The Decline?

$
0
0
Serena Williams has been, without a doubt, the best women’s tennis player in the past few years. In 2012 and 2013 combined, she racked up a win-loss record of an astonishing 136-8. She won no fewer than 18 titles in the 28 tournaments that she entered during that period. It is one of the most dominant periods for any woman in the history of tennis.

However, there have been indications in 2014 that she is beginning to slow down. It is no surprise – keeping the incredibly high level that she had been playing at was never going to be easy and she is not getting any younger. At 33-years old, she is the third oldest woman in the WTA top 100 and is the oldest world number one in history. She is the second oldest woman to win a Grand Slam singles title, only behind Martina Navratilova. She is performing at a higher level than virtually any woman of her age has ever done before.


While she is still the world number one, her advantage over the rest of the field has fallen slightly in 2014. At the end of 2013, she had 13,260 ranking points, giving her an enormous 5,214 lead over Victoria Azarenka. At the current moment in time, she currently has 7,146 ranking points and a lead of just 466 points, which could even be smaller come the end of the week. She has a record of 48-7 in 2014 thus far, which the rest of the field would die for, but which is relatively poor by her standards. Her six titles in 15 tournaments is also a drop for her.

So, things would suggest that Serena has not enjoyed such a good year, but can we pinpoint where exactly the decline in her results and performances might have come. To achieve this, we shall look at her statistical performance and compare it with 2013. The table below shows some basic statistics. For an more effective comparison, we shall focus on her primary surface – hard courts.

Statistic
2014
2013
% Won on 1st Serve
75.4%
75.1%
% Won on 2nd Serve
51.4%
49.6%
% Won on Return
46.7%
49.7%
BP Created/Game
0.88
0.90
BP Conversion Rate
102.7
112.6
DF/Game
0.38
0.28
Aces/Game
0.84
0.64
BP Faced/Game
0.46
0.46
BP Save Rate
92.5
100.7

What can we gather from this? First thing we notice is that Serena is actually winning more points on serve than she was last year - on both first and second serve. She is serving significantly more aces this year – an extra 0.2 per game – but also more double faults. Combine these facts together and we can probably conclude that she is going all out on the serve. She is looking for big aces and unreturnable serves with the first serve and taking more risks on the second serve, resulting in winning more points quickly, but also in more double faults. It is interesting that, despite the increase in points won on her serve, she is still facing the same number of break points per game as she was in 2013. It would suggest that she is maybe enjoying more quick and comfortable service games, but this is being counteracted by having more service games where her opponent is getting chances. In other words, her service games are verging toward the two extremes.

However, it is the return game that would appear to have declined this year. The points won on return has dropped by 3.0%, which is a significant margin, although again, it has only resulted in a small drop in the break points created per game, which has fallen by just 0.02. Again, this may suggest that she is still getting break point opportunities, but that she is also giving her opponent more easy holds during the match.

Her two break point rates* have also dropped significantly in 2014. The conversion rate of 112.6 in 2013 was an exceedingly high value – previously in her career, this value has tended to be between 100 and 103, where it has returned in 2014. The save rate of 92.5 in 2014 is slightly low, but in the past, she has managed to overcome a low save rate by the rest of her game being at such a high level.
So, how do those figures convert to actual games won? The table below gives an indication:

Statistic
2014
2013
% of Service Games Won
81.8%
84.3%
% of Return Games Won
42.0%
50.3%

Despite winning more points behind both her first and second serve, Serena has actually held serve less often in 2014 than she did in 2013. The bigger change, though, is in the return game. Last year, she was winning over half of her return games. However, this year, this figure has dropped by 8.3%, which is a far bigger change than the earlier stats might have suggested.

From what we have learned so far, we might draw the conclusion that Serena’s actual serve itself is working as well as it has ever done, but that her ground game is beginning to decline. Whether this is because her speed around the court is slowing slightly, meaning that she is unable to get into position, or whether it is simply age slowing her reactions, we cannot tell, but this would seem to be indicated by the stats.

We can dig further into this to try and find further evidence to support our theory. Here are some further statistics to look at:

Statistic
2014
2013
% Non-Ace 1st Serve Points Won
67.7%
70.2%
% Non-DF 2nd Serve Points Won
60.2%
56.1%

I have used the first of those statistics – the % Non-Ace 1stServe Points Won – as a proxy for looking at how players perform in rallies. We can see that on points where Serena gets her first serve into play, but does not serve an ace, she is winning 2.5% fewer points than she was in 2013. Interestingly though, she is actually winning more of the points on her second serve when she does not serve a double fault. This ties in with our idea earlier that she might be going for it more on the second serve to try to shorten points and avoid getting into rallies.

I now want to look in more detail at those break point numbers from earlier. If you recall, Serena’s break points created dropped from 0.90 to 0.88 per game, while the break points faced on her own serve remained constant at 0.46. This seems slightly out with the game win percentages that we saw, so could do with some further investigation.

Before looking at the statistics, my theory was that she was creating almost the same number of break points, but that many of these were coming in the same games, hence the lower conversion rate. It may show in the basic statistics as the same number of break points created, but this is a less desirable way of achieving that.

As an example, let us imagine that two players both have break point figures of 2/12 in a match. The first player created six break points in one return game and six in a second return game. The second player created one break point opportunity in twelve different service games. From this, you would probably suggest that the second player had demonstrated the better return game as he had created opportunity in virtually every service game. The first player had created plenty of chances, but all in one or two service games.

So, does this pan out for Serena Williams in 2014? The table below shows the figures:

Statistics
2014
2013
% of Service Games with BP Faced
29.5%
28.8%
% of Return Games with BP Created
52.9%
56.9%

We can see here that Serena is having to defend break points in 0.7% more of her service games and that she is creating break points in 4.0% fewer of her return games. So, combining several of these figures together, Serena is creating break points in fewer return games and is converting those break points less regularly. These are combining to give us the 8.3% fall in return games that she is winning in 2014.

It also helps to shows us where the fall in service holds is coming from. Despite winning more points, she is facing break points in more service games than she was before and is saving those break points less regularly. She may win plenty of cheap service games, but she is struggling to win those games where her opponent is forcing her into rallies.

These struggles on return also seem to emphasis themselves on those occasions when Serena falls behind in sets. The excellent Dan Weston of TennisRatings has looked at this recently – in 2013, Serena was able to recover a break deficit and get back on serve a massive 75.6% of the time. However, in 2014, this has dropped remarkably to just 57.5% - still top 5 in the WTA, but a decline of 18.1% nonetheless.

In conclusion, there is plenty of evidence to suggest a reasonable decline in Serena William’s performance in the past twelve months. To be clear, she is still comfortably the best player in women’s tennis – her advantage over the rest meant that she could decline yet remain the best. However, compared to her previous level, this year has been a worry. She is being forced to go for quick finishes on her serve to compensate for a declining ground game, which is working to an extent, but means that when her serve is not working at 100%, she becomes beatable. Her overall ground game is causing a decline in her ability to create break points and to recover deficits.

As a final overall statistic to show that Serena’s dominance is decline, in 2013, she won 67.6% of all the games in the 47 hard court matches that she played. In 2014, this had fallen to 61.9% in her 42 matches. A fall of 5.7% in the total games that she has won suggests that her matches are becoming closer and she is becoming more beatable.


* The BP Conversion Rate is calculated by dividing the % of break points won by the player's % won on return to determine whether he performs better or worse compared to an average point when he creates a break point on his opponent's serve. A value of 100 corresponds to performing exactly the same, whether it is break point or not, a value greater than 100 corresponds to performing better on break point than an average point and a value lower than 100 corresponds to under-performing on break point. In the same way, the BP Save Rate divides the % of break points saved on a player's serve by the % of points won on serve to determine whether he performs better when facing break point.

Predicting Break Point Performance

$
0
0
Break points are some of the most important points in a tennis match. Whether for the server or the returner, winning those points is often the difference between winning and losing the match. This raises the question, are there players that perform better than others on these big points?

The most commonly quoted statistics in this area are % BP Saved and % BP Won. Earlier in the year, the ATP wrote about how Ivo Karlovic had the highest % BP Saved for the year, ahead of Tomas Berdych and Jo-Wilfried Tsonga. Now that we have virtually reached the end of the season, looking at the list, we see John Isner, Ivo Karlovic and Feliciano Lopez at the top of the pile. However, the truth is that the big servers are always going to top this list. They could be mentally weak and under-perform on the break points, but because of their big serves, they will save plenty of break points.

The same is true on the % BP Won. The top returners will always top this list, while the 'servebots' will always find themselves at the bottom. Looking at the list, we find John Isner and Ivo Karlovic at the bottom with Feliciano Lopez fourth from bottom.

However, let us look more closely at Ivo Karlovic and John Isner. On a standard return point in 2014, Ivo Karlovic has won 28.0%, but when he creates a break point opportunity, he has won 31.6%. In other words, he is more likely to win on break point than on a standard return point. John Isner wins 30.1% of return points in 2014, but on break point, he is winning just 24.4% of points. In other words, he is less likely to win on break point than on a standard return point.

They both show up at the bottom of the list in terms of the actual number of break points converted, but we might suggest that Karlovic is better on converting break points than John Isner is. We can divide the % of BP Won by the % of Return Points Won to create a new measure - BP Conversion Rate. We can do the same with % of BP Saved divided by the % of Service Points Won to create the BP Save Rate.

These new measures give us an idea of how players perform on the break points and whether they over-perform or under-perform compared to their own average level. To give an idea, here are the BP Conversion and BP Save Rates for the top 10 in the WTA rankings:

Player
2014 BP Conversion Rate
2014 BP Save Rate
Serena Williams
101.7
97.4
Maria Sharapova
104.8
95.3
Simona Halep
105.3
93.0
Petra Kvitova
94.8
97.6
Li Na
109.1
102.4
Agnieszka Radwanska
104.3
95.5
Eugenie Bouchard
103.0
98.3
Ana Ivanovic
101.5
96.1
Caroline Wozniacki
106.2
99.8
Angelique Kerber
97.9
103.5

As we can see, the BP Conversion rate tends to be above 100, while the BP Save rate is usually below 100. This makes sense given that the server is usually under more pressure on break point and that the returner is likely to go for it more. Overall, the average BP Conversion rate is 104.5 and the average BP Save rate is 96.4.

Based on those averages, we might suggest that Li Na, Caroline Wozniacki and Simona Halep are particularly good at converting break points, while Petra Kvitova, Angelique Kerber and Ana Ivanovic are relatively poor. Similarly, Angelique Kerber, Li Na and Caroline Wozniacki are all strong at saving break points, while Simona Halep, Maria Sharapova and Agnieszka Radwanska are all below average at saving break points this year.

How does this compare with last year? The table below shows the conversion and save rates for the same players in 2013:

Player
2013 BP Conversion Rate
2013 BP Save Rate
Serena Williams
105.1
96.8
Maria Sharapova
103.5
98.4
Simona Halep
111.2
91.6
Petra Kvitova
107.6
105.5
Li Na
109.5
101.4
Agnieszka Radwanska
103.6
99.3
Eugenie Bouchard
101.3
93.6
Ana Ivanovic
102.1
97.3
Caroline Wozniacki
106.8
100.9
Angelique Kerber
103.7
101.9

Simona Halep, Li Na and Petra Kvitova all show up well in conversion rates in 2013, while Eugenie Bouchard, Ana Ivanovic and Maria Sharapova all show up poorly. In terms of save rate, Petra Kvitova, Angelique Kerber and Li Na show up well, while Simona Halep, Eugenie Bouchard and Serena Williams show up poorly.

This raises the question of whether certain players are consistently good at saving or converting break points, while other players are poor on the big points. This would fit in well with the idea that mental strength on the big points is hugely important in becoming a top level tennis player. Let us look at a plot of the 2014 BP Conversion Rate against the 2013 BP Conversion Rate to see whether a value in 2013 can allow us to predict what is likely to happen in 2014:


The chart shows all the players in the top 100 of the WTA rankings who have played at least 10 matches in both 2013 and 2014. At first glances, everything seems to look pretty random. In total, there were 14 players with BP Conversion Rates of over 110 in 2013. In 2014, just three of these players had values of over 110 - Yanina Wickmayer, Shuai Zhang and Francesca Schiavone. A further three of these players had values between the WTA average of 104.5 and 110, while three more players showed values of below 100.

If we look at the reverse, there were 19 players that had BP Conversion Rates of below 100 in 2013. None of these players flipped to a value of over 110 in 2014, but eight of them improved to values of above the WTA average in 2014. Seven of them remained below 100 in 2014.

The R squared value for this is 0.0032, which suggests that as a sample, there is virtually no correlation between the value in 2013 and the value in 2014.

Now, let us look at the same chart, but for the BP Save Rate:


There are 15 players with a BP Save Rate in 2013 that was above 102.0. Moving forward to 2014, there are four of these players that still have a BP Save Rate of above 100, while seven have dropped to below the WTA average of 96.4. Those four players that have remained above 100 in the second year are Barbora Zahlavova Strycova, Mirjana Lucic-Baroni, Elena Vesnina and Roberta Vinci.

As with the conversion rate, we find an R squared value of 0.0021, so again there is no overall correlation at all.

For those four players that we found with successive high values on the BP Save rate, let us look further back. The table below shows the values:

Player
2014
2013
2012
2011
2010
Barbora Zahlavova Strycova
102.1
108.2
103.8
99.4
102.7
Mirjana Lucic-Baroni
105.5
105.2
90.8
96.5
94.1
Elena Vesnina
100.9
104.1
92.7
94.1
93.2
Roberta Vinci
101.1
103.0
97.6
97.9
102.5

Barbora Zahlavova Strycova's figures are massively impressive. Four out of five years, she has finished with a value above 100.0, while the other year, she is still well above the WTA average. Mirjana Lucic-Baroni has scored above 100.0 for the past two years, but the three years before that, she was below average. Elena Vesina is pretty much the same as Lucic-Baroni in terms of three below average years before her recent improvement, while Roberta Vinci has three values of over 100.0 with two further above average values.

We cannot completely rule out certain players being particularly good at break points or certain players being particularly bad without further investigation, but on the whole, we cannot use the previous year's performance to determine how a player is likely to perform in the coming year on break points.

The Curious Case of Maria Sharapova

$
0
0
Until three years ago, Maria Sharapova had never reached the final of the French Open and had just one major clay court title to her name. Since then, she has lifted two French Open titles, three Stuttgart titles, plus titles in both Madrid and Rome. In the same period, she has won just two hard court titles in Indian Wells and Beijing and no grass court titles. For a player that had won all three other Grand Slam titles, plus major titles in Indian Wells, Doha, Cincinnati and Tokyo, it is quite a change.


Sharapova famously described herself as feeling like a ‘cow on ice’ on a clay court, back in 2007 after beating Jill Craybas, but she is arguably now the standout clay-court player on tour. Given her results on the other surfaces, she is almost becoming a clay court specialist. Since her clay court rebirth at the start of 2012, she has compiled a clay court record of 54-4. The only players to have beaten her during this period are Ana Ivanovic and her nemesis, Serena Williams. At the same time, her record on all other surfaces is 58-12. Still not a bad record, but certainly worse than on clay.

In 2014, Sharapova went 31-12 on all surfaces other than clay, winning just one title and losing in the 4th round of all three Grand Slams. However, on clay, she has compiled an outstanding 19-1 record, winning three titles including the French Open. So, can we look at her statistics and try and see what is going on? We shall focus on 2014 and compare clay against hard courts.

Statistic
Hard
Clay
% Won on 1st Serve
65.3%
69.4%
% Won on 2nd Serve
45.2%
47.3%
% Won on Return
47.6%
49.0%
BP Created/Game
0.91
0.89
BP Conversion Rate
100.6
108.4
DF/Game
0.61
0.42
Aces/Game
0.29
0.27
BP Faced/Game
0.72
0.63
BP Save Rate
97.7
93.0

In general, return is more dominant on clay courts than on hard courts, so we would expect to see a player winning more points on return and fewer points on serve. Sharapova demonstrates the stronger return with 49.0% on clay as compared to 47.6% on hard courts. However, it is her service statistics that are peculiar. She wins 4.1% more points on her first serve on clay than she does on hard courts and 2.1% more on her second serve. Generally, the WTA average is to win 1.8% fewer points on first serve and 0.6% fewer on second serve. Clearly, Sharapova’s serve is working far better on clay than on hard courts for some reason.

Despite winning 1.4% more points on return on clay, this has actually converted to creating fewer break points on clay per game. There are a number of possible reasons for this that we shall investigate later. The first though is the much better conversion rate, suggesting she needs fewer break points to create the break on clay than she does on hard courts.

One of the strangest statistics is the double faults per game. Generally, there is virtually no difference between double faults on hard courts and on clay courts. If anything, there is a fractional increase on hard courts, but nothing compared to Sharapova’s figures. Her 0.42 on clay is a bit higher than the WTA average, but the 0.61 on hard courts is a huge figure. Why it is so much higher is a mystery, but it means that in an average match of around 11 service games, she is serving around 6.7 double faults per match – almost a game and a half worth of points for her opponent. As one might suspect, the lower service point win percentages, combined with the double faults, means that she faces significantly more break points on hard courts than on clay – 0.09 per service game in fact.

Winning points is all well and good, but it is games that are the most important. This is how the earlier figures translate into service and return games won:

Statistic
Hard
Clay
% of Service Games Won
68.6%
72.8%
% of Return Games Won
43.7%
47.3%

As we might expect, Sharapova wins more of both service and return games on clay courts. A difference of 4.2% and 3.6% respectively may sound small, but they are actually quite significant.
We noted that the double faults on hard courts are incredibly high – could this be a major part of Sharapova’s problems on the surface? The figures below can help us to look into this:

Statistic
Hard
Clay
% Non-Ace 1st Serve Points Won
62.7%
67.2%
% Non-DF 2nd Serve Points Won
59.0%
57.8%

Here, we finally see a statistic where her hard court performance is superior. If we exclude double faults, she wins 59.0% of second serve points on hard courts, compared with 57.8% on clay courts. As a comparison, in 2014, Serena Williams won 60.2% of non-DF 2nd serve points, so Sharapova is actually not far behind at all. The fact is though, once you include the double faults, this plummets down to 45.2%, compared to Serena’s 51.4%.

It is still interesting though that Sharapova is still winning significantly more non-ace first service points on clay than on hard – not a usual situation for a player such as Maria.

Break points are generally the most important points during a match. We noted earlier that, despite winning more points on return on clay, Sharapova actually creates fewer break points on clay. Let us look in more detail at her break point creation. The table below will help to analyse this:

Statistics
                       Hard
Clay
% of Service Games with BP Faced
42.7%
38.4%
% of Return Games with BP Created
55.6%
57.3%

Here, we can see that Sharapova actually creates break points in more return games on clay than on hard courts. Combined with the break point creation and conversion statistics from earlier, it would seem that Sharapova is struggling to convert break points on hard court, whereas she is more clinical on clay courts for whatever reason. Similarly, she faces break points in far more service games on hard courts than she does on clay. Going back to our average 11 service games, she faces break points in 4.7 service games on hard and 4.2 service games on clay.

So, can we go any further into testing our theory that Sharapova struggles to convert break points on hard courts. The table below looks in more detail:

Statistics
                       Hard
Clay
% of Service Games Facing BP and Won
                    26.6%
29.1%
% of Return Games Creating BP and Win
79.1%
82.5%

On hard courts, we can see that Sharapova breaks serve in 79.1% of the service games in which she creates break points, which is 3.4% fewer than on clay. We also see here that, despite having a lower BP save rate on clay, she actually holds serve in 29.1% of those service games where she faces break point on clay compared to 26.6% on hard courts.

To put these figures in context, Serena Williams in 2014 actually holds serve in 38.5% of those service games where she faces break points and breaks serve in 79.4% of return games where she creates break points.

It would seem that there are not too many problems with Sharapova’s ability to convert break points on hard courts, even though it is lower than on clay courts, where she is clearly exceptional. However, for a player that is supposedly known for being so mentally strong, she would be hoping to save break points more regularly.

The biggest concern for Sharapova really must be the double faults on hard courts, followed by the disappointing first serve win percentage. If she is able to cut down the double faults, even just to the level that she serves on clay, which is still a little too high really, this should massively help her. The non-DF second serve points won suggests that she is performing adequately in the rallies, but she just needs to ensure that she does not just donate points on her own serve. From the statistics, it is tough to really explain what she needs to improve on her first serve, but it is a clear area to work on.

Lower Level Tennis Weekly Review

$
0
0
I am not sure how much interest there might be in this, but I thought it would trial it as an idea. The idea is a weekly review of the ITF and junior tennis winners and results in a single article. There is obviously plenty of coverage of the main tour, but very little mention of the lower tours. To begin with, it will only cover women's tennis at ITF and both boys and girls at junior levels. However, if there is interest in this series, I may look to include men's ITF and possibly even Challengers in the future. So, here is the first article in this series.

ITF

ITF $75k Events


Alexandra Dulgheru was the big winner last week, lifting her second title of the year in the $75k event in Dubai. The sixth seeded Romanian dropped just one set all week and saw off Kimiko Date-Krumm 6-3, 6-4 in the final. Vitalia Diatchenko continued her good recent form that has seen her reach the QF in Moscow and win the $125k title in Taipei with a run to the SF in Dubai, which puts her top of the Road to Singapore rankings, albeit at this very early stage. However, she will be hoping that the problems that caused her to take two medical timeouts are nothing serious.


Alexandra Dulgheru won the title in Dubai last week


ITF $50k Events


In Australia, Chinese player, Fangzhou Liu, won her first ever career title with a 6-4, 6-3 victory over Japan’s Risa Ozaki in the Bendigo $50k final. The 18-year old, who reached the final in Nan Chang earlier in the year, also recorded good wins against Daria Gavrilova and Misa Eguchi on her run to the title.


ITF $25k Events


Evgeniya Rodina made it back-to-back titles in Sharm El Sheikh as she continues her rise back up the rankings after two years of injury problems. Her 5-7, 6-3, 6-2 victory over second seed, Laura Siegemund, for the second week running, sealed her fifth $25k title of the year and lifted her to #132 in the world. Back-to-back finals for Siegemund also sees the 26-year old German break the top 150 for the first time in her career.


In Mumbai, third seed Marina Melnikova clinched her first title for six years with a straight sets win over Tadeja Majeric in the final. Despite the long wait and two final defeats this year, there appeared to be few nerves for Melnikova as she cruised to a 6-2, 7-6 victory. However, she could easily have been beaten in the SF after Emily Webley-Smith served for the match in the second set and led by a break in the decider. There was little for the home crowd to cheer in the singles, but Ankita Raina was victorious in the doubles with her partner Jia-Jing Lu as they beat top seeds Nicha Lertpiaksinchai and Peangtarn Plipuech in the final.


Ana Vrljic won her first title of 2014 in Minsk after seeing off the challenge of Ekaterina Alexandrova in an epic battle. Both players had opportunities in a tight final set, but it was the Croatian that eventually prevailed 3-6, 6-4, 7-6. One name to keep an eye on may be 16-year old Vera Lapko, who reached the QF in her first ever senior tournament on hard courts.


ITF $10k Events


15-year old Nina Alibalic was the most notable winner in the $10k events last week as she lifted the title in Antalya after a 6-3, 6-0 win over Kristina Schmiedlova to become the 7th youngest ITF champion of 2014. Due to weather delays, she had to win three matches in two days to lift the title.

Elsewhere, there were titles for Amy Bowtell (Helsinki), Natalija Kostic (Heraklion), Silvia Njiric (Casablanca), Olga Saez Larra (Castellon) and Natela Dzalamidze (Sousse).


Juniors


The week’s highest profile junior tournament was the 2014 Seogwipo Asia Oceania International Junior Championships, held in South Korea. It was an event dominated by the top seeds with South Korea’s Yunseong Chung and China’s Shilin Xu lifting the boy’s and girl’s titles respectively as top seeds. Both players were so dominant that neither lost a set all week with Chung defeating Japan’s Naoto Kai 6-1, 7-5 in the final, while Xu made it 17 consecutive junior victories with a 7-6, 6-2 victory over Wushuang Zheng in the final that cemented her place at the top of the junior rankings.

Shilin Xu continued her excellent form at junior level

Elsewhere, sixteenth seed Edan Leshem won the boy’s title in the Grade 2 event in Israel, while the highly rated 15-year old Russian, Evgeniya Levashova, won the girl’s edition, coming from a set down in the final to beat Valeriya Yushchenko 3-6, 6-3, 6-2 in Ra’anana. In Boca Raton, there were Grade 4 titles for Britain’s Californian-based Ryan Storrie in the boy’s and unseeded 14-year old American, Carson Branstine, in the girl’s.

Lower Level Tennis Weekly Review 2

$
0
0
ITF

ITF $75k Events

From the first day onward, there was just one European in the entire draw at the $75k event in Toyota, Japan, but that had little impact as An-Sophie Mestach stormed to her fourth title of 2014 and the biggest win of her career. She dropped just 13 games all week and capped it off with a dominant 6-1, 6-1 win in the final over Shuko Aoyama. It was an excellent week for the Belgian as, not only did she clinch the title, but she also secured a main draw spot for the 2015 Australian Open. It was just over two years ago that Mestach fell off the rankings list entirely after a series of injuries, but she has now broken the top 100 for the first time in her career. Aoyama's run to the final also clinched her a qualifying spot for the Australian Open.

An-Sophie Mestach clinched an Australian Open main draw spot in Toyota

Another player to clinch their spot at the Australian Open was Kimiko Date-Krumm, whose run to the semi-final lifted her 12 spots in the rankings to #89. She retired after the first set against Mestach in the semi-final, but her week will have delivered the desired outcome, having outed several promising young players in Ozaki and Hibi. Interestingly, it was Hibi's first professional tournament in the country of her birth and her first trip back to Japan in five years.

Date-Krumm was not the only older player to have a good run as former world #19 Tamarine Tanasugarn rolled back the years in a run to the QF. Wins over Namigata, Chang and Kumkhum would have been a good confidence boost for the Thai player and she may even consider entering the Asian wildcard tournament for the Australian Open.

The big loser for the week was undoubtedly Luksika Kumkhum. A QF exit for the top seed means that she drops out of the top 100 and will miss out on a main draw spot at the Australian Open. With second round points to defend in Melbourne, she will need to ensure that she come through qualification to avoid a big drop in her ranking.

ITF $50k Events

New Delhi is hardly renowned as a tennis hot spot, but it could be where the senior career of Ivana Jorovic really took off. The former junior #1 and French Open junior finalist clinched the biggest title of her fledgling career as she lifted the $50k title at the DLTA Complex in New Delhi. She also recorded the biggest win of her career when she took out #2 seed Anastasiya Vasylyeva in the SF before beating fellow teenager Barbora Haas in the battle of two unseeded players in the final. It is a win that lifts her over 100 places in the rankings and sets her up nicely for her first full year in the senior ranks in 2015.

Ivana Jorovic won the biggest title of her career thus far in New Delhi

It also marked the end of a successful year for Barbora Haas, who reached her 8th ITF final of the year, although she will be disappointed to have lifted just the two titles. However, having lost her opening set of this tournament 6-0 against Sofiya Kovalets, she will have been relieved to have simply made it that far.

There was disappointment though for her compatriot, Patricia Mayr-Achleitner. A run to the title would have given her a main draw spot for the Australian Open next year, but a QF defeat to Haas put pay to those hopes and means that she will have to qualify if she hopes to play the first Grand Slam of 2015.

The other $50k event of the week took place on the clay in Asuncion and was won after a herculean effort from Bianca Botto. With the semi-finals and the final taking place on the same day, she had to come from a set and a break down in the semi-final against Pivovarova to win 4-6, 6-3, 6-4 before beating Florencia Molinero in the final, who had cruised her semi-final earlier in the day. It was a fourth title of 2014 for the Peruvian and the biggest title of her career to date.

There was disappointment for the home fans as first Veronica Cepede Royg, then Montserrat Gonzalez were eliminated by Molinero, with Cepede Royg collapsing to a 3-6, 6-3, 6-0 defeat after losing the last nine games of the match.

ITF $25k Events

There was only one $25k event last week, but it was dominated by the teenagers. Three of the four semi-finalists were aged 18 or under, but it was Oceane Dodin that continued her excellent run of form to lift the title. The results of her last four ITF events read W-F-SF-W and she shows no sign of slowing, having risen over 400 places in the rankings in 2014. It was Latvia teenager and Wimbledon junior champion, Jelena Ostapenko, that she beat 7-5, 6-4 in the final, although Ostapenko might count herself a little lucky to have been there after Kostova collapsed from 6-2, *4-2 ahead in their SF clash. The other semi-finalist was Ukraine's Anhelina Kalinina, who enjoyed a good run by seeing off two seeded players in Katerina Vankova and Indy de Vroome. However, she topped off a good week by lifting the doubles title with her partner, Anna Shkudun.

ITF $10k Events

There were two teenage winners in the $10k events last week as Viktoriya Tomova won her third title of 2014 in Sousse, while Kristina Schmiedlova, the younger sister of #74 ranked Anna, won her first senior title in Antalya.
Elsewhere, there were also titles for Corinna Dentoni in Casablanca, Olga Saez Larra in Nules and Vojislava Lukic in Sharm El Sheikh.

Juniors

Some of the world's leading junior players converged on Mexico City last week for the Abierto Juvenil Mexicano and both the boys and girls events produced great entertainment. It was America's Michael Mmoh that clinched the boys title after a three set final against Seong Chan Hong, although he had to come from a break down in the deciding set. A number of questionable line calls in the final set had gotten the crowd fully involved on the side of the Korean, but Mmoh kept his cool to clinch his second Grade A title and extend his recent run to 20-1 on both junior and senior tours. He will have been particularly pleased with a straight sets win over top seed Andrey Rublev in the semi-final, while for Hong, this was the best run of his career to date.

In the girl's event, Dalma Galfi extended her winning run to 19 matches after adding her first Grade A title to her back-to-back senior titles in Greece. The 16-year old Hungarian saw off sixth seed, Natalia Vikhlyantseva, in the final having taken out the second seed, Anna Kalinskaya, earlier in the tournament. It was just one step too far for Vikhlyantseva, having beaten US Open champion, Marie Bouzkova, and third seed Fanni Stollar, in consecutive rounds to reach the final. You can watch the entire final below.


Restructuring Prize Money on the ITF Tour

$
0
0
In the past year or so, there have been several excellent posts and letters written by lower level tennis players concerning the issue of lack of pay on the Challenger and ITF Tours. The main two that I would recommend reading as a prelude to reading this post are James McGee’s blog post entitled ‘Financing the Tour’ (available here) and Tomas Buchhass’ recent open letter to the ITF (original here or translation here). They give an enlightening account of the difficulties of financing a career on the minor tours and how the glamorous image of a professional tennis player is no more than a myth for the majority of players outside the top 50 or so players.

ITF events usually take place with almost no spectators in places
such as Antalya and Sharm El Sheikh

The biggest problem is the prize money issue at the lowest levels of the game. A brief bit of history to begin with. On the women’s side, in 1984 there were 26 low level tournaments in Europe and 14 in the USA with a total prize money of $340,000. This roughly works out at $8,500 prize money for each of the tournament assuming they were equally split. In 2014, the lowest level of ITF tournament has a total prize money of $10,000. In other words, in the past 30 years, the prize money at the lowest level of tournament has increased by $1,500 or 17.6%. At the same time, the prize money at Wimbledon has increased from £1,461,896 in 1984 to £25,000,000 – an increase of £23,538,104 or just over 1,600%. In 1984, had they decided that the prize money at tournaments would be linked to the inflation rate, that $8,500 tournament, given the rate of inflation in the UK over the past 30 years, would now be offering prize money of just over $25,000. In real terms, the prize money at that level has dropped massively in the past three decades.

Every player will have to come through the ITF and Challenger Tours at some stage during their career. The top players may only spend a brief period there, but according to the ITF website, “the WTA singles ranking list for the end of 2012, released on 31 December, showed that all but two players have, at some point during their career, competed on the ITF Pro Circuit.” Without a minor tour to ease the transition from juniors to seniors, there would arguably be no senior tour.

While the ITF is a different organisation to the WTA or ATP, they are inextricably linked. They are dependent on each other and so cooperation between the two can only be beneficial. I say this as an assumption to my proposal for changing the tennis pay structure, which requires cooperation between the three organisations.

I shall focus on the women’s tour, but the same principal could easily be applied to the men’s, albeit with the slight complication of the Challenger Tour, which means that men have three levels, rather than two.

In 2014, including Grand Slams and the Hopman Cup, there were 59 WTA senior tour events. At the same time, there were 596 ITF events during the year. The grand total of prize money that was given out in the 59 WTA senior events was just under $107.5m, while the grand total for the 596 ITF events was just over $11m.

The ITF Tour itself is broken down into various different levels of tournament, classified by the amount of prize money and ranking points available. The table below shows the different categories, the number of each tournament and the total prize money at each level.

Category
Number of Tournaments
Total Prize Money
$10k
388
$3,880,000
$15k
26
$390,000
$25k
120
$3,000,000
$50k
44
$2,200,000
$75k
7
$525,000
$100k
11
$1,100,000

The truth is that tennis can only support a limited number of professional players. Regardless of prize money, with a limited number of tournaments, there are only a set number of players that can ever hope to make a living from the sport. There are roughly 2,000 ranked players in the WTA – a number that has been roughly steady for a while and is likely to remain so in the future. However, given the real decrease in prize money at the lowest levels, many players are being priced out of the sport. Increasingly, a sponsor or rich family are becoming the main way that young players can afford to compete on the tour.

Let us take a random tournament on the WTA Tour to look at. Just as an example, let us focus on the WTA event in Pattaya City. In 2012, the total prize money was $220k. This rose to $235k in 2013 and $250k in 2014. In other words, it is increasing by $15k per year. Based on this, in 2015, the prize money will rise by 6% to $265k while the prize money on the ITF Tour will not change.

What if each of the 59 tournaments on the main WTA Tour were to donate a small percentage of the prize money that is available to a pool that is used to increase the prize money at the ITF level? This is where cooperation between the ITF, the WTA and the tournaments themselves would have to be improved. Had this happened at the start of 2014, how might this be able to change the ITF Tour?

What if each tournament pledged to donate 4.75% of their prize money to a newly created ITF pool? This would raise just over $5.1m, which combined with the current $11.1m that is already on offer, would give us a prize money pool for the ITF Tour of $16.2m.

James McGee wrote an excellent piece about the struggles on the minor tours

How would this affect the WTA tournaments though? Returning to our earlier example of Pattaya City, the total prize money for the tournament in 2014 would drop from $250k to $238k – still a prize money increase from the 2013 level, albeit only a small increase. Assuming the 4.75% was deducted equally from each round, the winner would now receive a cheque for just under $41,000 rather than $43,000, while a player losing in the first round would receive $2,095 rather than $2,200. Obviously, it would be up to individual tournaments to determine how they restructured their prize money. A tournament may rather deduct more from the winner’s cheque to reduce the deduction for the first round losers, although it is up to them. Either way, we are not looking at huge reductions in prize money.

How would this affect the ITF though? Using the increased pool of prize money, we could convert the $10k events to $15k events. While this is still well below what they would be had they been linked to inflation, it immediately brings about a 50% increase in prize money for each event. Similarly, the $15k events could be increased to $25k events and so forth. The table below shows the changes that could be made:

Previous Category
New Category
New Total Prize Money
Prize Money Increase
$10k
$15k
$5,820,000
50.0%
$15k
$25k
$650,000
66.7%
$25k
$40k
$4,800,000
60.0%
$50k
$75k
$3,300,000
50.0%
$75k
$75k
$525,000
0.0%
$100k
$100k
$1,100,000
0.0%

The new total prize money for our new events is $16,195,000, which leaves us just over $4k spare from our new prize money pool. While there may be an argument for looking to increase the $75k and $100k events as well, this is not the priority at the current time.

Let us look in slightly more detail at what this would mean for a former $10k event. The table below shows the prize money changes for each round, assuming the extra prize money was distributed equally across rounds:

Round
Old Prize Money (Singles)
New Prize Money (Singles)
Old Prize Money (Doubles)
New Prize Money (Doubles)
Winner
$1,568
$2,352
$637
$955.50
Finalist
$980
$1,470
$343
$514.50
SF
$490
$735
$196
$294
QF
$245
$367.50
$98
$147
R16
$196
$294
$49
$73.50
R32
$98
$147
-


The winner of a former ITF $10k event would now receive $2,352 rather than $1,568 – an increase of $784. Obviously only one player can win, but a player that lost in the second round would now receive almost $100 more than they would have previously. While this does not necessarily sound like a huge amount of money, it could make a huge difference to players at that level. If you played 30 tournaments in a year and reached the second round of every tournament, that would equate to an extra $2,940 over the course of the year.

The table below shows the same calculations for one of the 120 former $25k events:

Round
Old Prize Money (Singles)
New Prize Money (Singles)
Old Prize Money (Doubles)
New Prize Money (Doubles)
Winner
$3,919
$6,270.40
$1,437
$2,299.20
Finalist
$2,091
$3,345.60
$719
$1,150.40
SF
$1,144
$1,830.40
$359
$574.40
QF
$654
$1,046.40
$196
$313.60
R16
$392
$627.20
$131
$209.60
R32
$228
$364.80


A player that reached the QF of a former $25k event and also lost in the QF of the doubles would now receive a cheque for $1,360 for their week’s work, rather than the $850 that they would previously. Given that James McGee estimated that an average weekly expenditure with no coach for him was roughly around €1,200 or $1,500, we are beginning to get toward the point where players can start to break even at a slightly lower level.

This might start to mean that players rise up the rankings based on their natural ability and hard work rather than their ability to afford a coach, whether that be through coming from a well-off federation, a rich benefactor or wildcards into bigger events.

Will this happen? Almost certainly not. There has been no interest in changing the prize money structure at the ITF level for many years, so it is tough to see this changing in the near future. Would the WTA, ATP and ITF be able to come to an agreement to see this prize money pooling happen? Probably not.

However, something does need to be done. It is madness that there has been virtually no change in absolute prize money in almost three decades and a huge fall in prize money in real terms. Maybe this idea is not the way forward, but the debate needs to be had. Otherwise, we may well just see more and more talented players giving up on the game too early simply because they cannot afford to keep playing.

Analysing a Tennis Article

$
0
0
While there are plenty of very good tennis writers putting their thoughts onto paper, there are also plenty of other articles that seem to get disseminated that are simply nonsense. Whether they are meant to be written in that form to generate hits and discussion or whether the writer truly believes what he is writing is not always clear, but the quantity of nonsense that comes from certain writers does make me wonder at times.

The IPTL has split opinions, but the local crowds have been getting into it

As an exercise, I am going to look at one of these articles and try and break it down to see whether the arguments and statements are actually sensible or whether it really is nonsense. As some of you may have gathered from my Twitter feed, I have been following the new IPTL tournament closely for various reasons – both professional and personal. The article that I will look at is this one, entitled ‘The International Premier Tennis Leaguehas no future, hopefully.’ It is published on GiveMeSport by Harry Wall, their lead writer.

“Sadly, the chance to see legends play again is the only thing great about this new monstrosity. Sky Sports have taken a gamble by airing the matches but perhaps, hopefully, they'll decide to opt out next year given the chance.”

Even if we had not gathered from the headline, we are told very quickly that he is not a fan of this new event. Apart from the chance to see the legends, he is clearly not enjoying the tournament. As he correctly states, Sky Sports have picked up the event, which is excellent for fans, who will have the opportunity to see for themselves as to how the new event works. I am not entirely sure why, at this point in time, they would consider dropping it. If it continues, you would imagine that Sky Sports would renew their contract, if only to stop BT Sport or Eurosport picking up the event. People will watch tennis on TV if it is on and of a decent quality. With a host of top 20 singles players, some high quality doubles and legendary names from the past, that is enough to attract casual viewers. At the time of day that it is on, it is quite likely one of Sky Sports most viewed programmes given that it is one of the few live events at that time of the day.

“I don't wish to sound rigid, miserable or negative but come on, this is complete and utter garbage. It's like a tennis tournament made for Fisher Price; an easy to understand, fun and interactive experience for the kiddies.”

With statements like that, how could he possibly sound negative? Surely there is no way that calling something ‘complete and utter garbage’ could be construed in a negative way? Besides, given the general confusion amongst players, officials and viewers alike, it seems that ‘easy to understand’ is about as far from the truth as possible.

“Nightclub music (to which some players embarrassingly bounce along to), flashing lights, shot-clock timers, team fist-bumps between points and the pathetic franchise names - it all reeks of a utter sham designed to make money.

I can see why some purists may dislike the music and lights. To spectators watching on TV, it probably does not add a great deal. However, it surely improves the atmosphere for the spectators that are actually at the event. It gets them involved and it creates a visual and auditory spectacle during the normal downtime during matches. Furthermore, I don’t see what the problem with players getting involved with the music is. Would he rather they all sat quietly with their heads bowed?

Are naming the franchises really harming anyone? In a team event, the teams have to be called something surely. Why not give them names beyond just the name of the city? Maybe the sponsor names added to the franchise names sounds a little ridiculous, but the money has to come from somewhere and sponsorship is becoming a bigger deal in all sports, not just tennis. Nobody complains about the BNP Paribas Masters, so what is wrong with the Micromax Indian Aces? Simply through the sponsorship, the company is going to advert the event just to get their names out there. Further publicity for the tournament cannot be a bad thing.

Finally, at the end of the day, is something designed to make money a bad thing? With the tournaments that are being cancelled due to lack of money and sponsorship, why is making money seen as a bad thing?

“The organisers claim that this will be the future of tennis

Of course the organisers are going to claim that. It would hardly be advertising their tournament to say that it was just a pointless exhibition with a modified set of rules. Just because they say this does not mean that it is true.

“Why exactly does tennis need to change its future anyway? - I wasn't aware there was anything wrong with the present.

Does tennis need a radical overhaul for the future? Of course not. Is there scope for tennis to evolve, both in a sporting and a commercial sense? Of course there is. Sports must evolve over time to remain relevant in an ever more competitive marketplace. Tennis, in terms of attracting spectators and fans, is not only competing against other sports, but other activities full-stop. For some people, watching tennis, whether on TV or live at the event, will be seen as a substitute for going to watch a football match. For others, it may be for watching a film or an episode of their favourite TV show.

“However, tennis doesn't face issues of declining interest, lack of excitement or money woes. I tried to find tickets for Wimbledon and the ATP World Tour Finals in London this year, unsuccessfully. Take a look at prices and availability - you'll see tennis as a sport is in good health on its own.

This section is simply untrue is parts. In the past month, the Oeiras WTA tournament has been cancelled, while the ATP version is in serious doubt. While not officially confirmed, the Valencia ATP event that Andy Murray won in October is expected to have been the final edition of the event. In recent years, the Belgrade ATP event has disappeared, Dusseldorf has lost its ATP event after just two editions. All of these tournaments have disappeared for financial reasons stemming from lack of sponsorship and big financial losses in recent years.

When we watch many tournaments around the world during the ATP and WTA season, we cannot help but be struck by the empty seats on view. While the Grand Slams are usually packed out on the main courts, the majority of tournaments below that level struggle to fill their stands.

Wimbledon regularly sells out, but that is far from the case at other tournaments

Using Wimbledon and the ATP World Tour Finals in London as examples are fairly ridiculous. Tennis tournaments in England tend to be an exception to the rule. Main court tickets at Wimbledon are generally only available through a very oversubscribed ballot, while there are huge queues for ground passes. Tickets for the ATP event at Queen’s are allocated via a ballot, while the ATP World Tour Finals have been virtually sold out for every session since it came to London. Put simply, the British public, partially driven by the Andy Murray effect, love watching live tennis and will pay high prices for tickets to do so.

Outside of the UK, the situation is often very different. Tickets for the Rome Masters are cheap and it is not difficult to buy them, even on the day itself. I have been to the old WTA event in Marbella and the joint ATP/WTA event in Sydney and bought tickets on the day for the main court with no problems. The courts were even fairly empty for both of them.

Is there declining interest in tennis? Probably not. Certainly not in the UK, but I cannot say for sure about other countries. I would imagine not in most countries. Possibly in the USA given the lack of high-profile Grand Slam contenders outside of Serena Williams. Does the lack of declining interest mean that tennis should not try to continue appealing to new fans? Of course not.

“Do you find tennis boring? Did you find the Wimbledon final boring this year? Have you found the Grand Slam finals between Rafa Nadal, Roger Federer and Novak Djokovic boring in recent years? Do you find the battle for world no.1 boring?

If you simply find tennis boring, it is unlikely that any innovations or changes will attract you to the sport. Was the Wimbledon final boring this year? Of course not. It certainly was not the greatest final in recent times – the only reason it went five sets was Djokovic choking at critical moments – but it was an enjoyable match. Of course the Grand Slam finals between three of the greatest players to ever play the game have not been boring. The battle for world number 1 is not boring. However, surely tennis exists outside of the top 3 players?

Tennis has been blessed in recent years to have had three such outstanding players. For the ATP, it has been a golden generation. However, this will not continue forever. Even the evergreen Roger Federer will surely have to call it a day in the next few years. We do not know how long Rafael Nadal’s ever more brittle body will hold up to the strain of a full schedule.

These stars will be replaced. The cycle will go on. But the next generation may not live up to the standards set by the current superstars of the game. The sport as a whole has to be positioned to be able to cope with this. To decide whether a sport is boring based on matches between some of the greatest players to ever pick up a racquet is ridiculous. You may as well ask whether watching Lionel Messi or Diego Maradona playing football is boring. Of course not, but not every match has one of those players.

“Tennis is a sport which is doing just fine. I'm sure the players will agree. The likes of Federer, Nadal and Maria Sharapova are all pushing 15 million fans on Facebook. 15 million! That figure is in-line with most top-end footballers and football clubs, and nobody is calling for clubbing music or fireworks between substitutions in the Premier League....”

I am fairly sure that the player seem to be thoroughly enjoying their time at the IPTL. Obviously, the appearance money will undoubtedly be helping, but they do seem to be enjoying the camaraderie of the team format, the crowds are getting behind them and there is no sign that the players are not enjoying it. Will all professional tennis players agree that the sport is doing just fine? Almost certainly not. Plenty of players from top 50-100 players all the way down have brought up the issue of money being disproportionately weighted toward the top players, who arguably need the money the least.

Federer, Nadal and Sharapova have roughly the same number of Facebook fans as top-end footballers? Not quite sure what that has to do with anything. And I am pretty certain that there is now music that accompanies goals at the majority of grounds, music before the match, at half-time and after the match, half-time entertainment and cheerleaders at some matches. There are fireworks after big finals at matches as well. That argument seems fairly moot.

Aston Villa: A Half-Season Analysis

$
0
0
It has been a season of mixed emotions thus far for Villa fans. The club’s best start in many years was followed by a dismal run of defeats and the longest scoring drought in Premier League history, followed by a run of just one defeat in seven games, most recently leading to a point against Manchester United, our biggest bogey team.

This article will look in a little more detail at some of the statistics behind the results that see Villa in 12th position in the Premier League table going into Christmas.

The aspect that has been the most worrying for Villa this season has been scoring goals. As the table below shows, Villa have scored the fewest goals in the Premier League this season:

Statistic
Value
Premier League Rank
Goals For
10
20th
Total Shots For
153
19th
Shots on Target For
44
19th
Shots per Goal For
15.3
19th
Shots on Target per Goal For
4.4
                      20th                                        

The lack of shots and shots on target is just as concerning. Only Hull have created fewer chances this season as Villa and the shots per goal scored shows that Villa are failing to convert the relatively few chances that they are actually creating.

Let us look into more detail as to how Villa’s shots are being created and see whether that can explain the poor conversion rate.

As some background, this article from Colin Trainor suggests that there is a reasonably strong correlation between speed of attack and conversion rates. The faster the attack from a team, the greater the conversion rate of the shots that are generated from those attacks.

Michael Caley has compiled some very useful statistics here that we can use to look into more detail at Villa’s attacking ability. Interestingly, we can see that 25.0% of Villa’s shots this season have come about as a result of a fast attack. While this tallies well with our idea of Villa as an attacking team, it would suggest that the expected conversion rate for Villa this season should be fairly high. Instead, we can see that Villa require more shots on target per goal than any other team.

Villa’s 43.4% of shots from the ‘danger zone’, where the greatest chance of scoring comes from, again suggests that Villa should be creating relatively high value chances. This is 3rd highest of all the teams in the Premier League.

So, the chances that are being created are from quick counter-attacks and in the most dangerous areas. The fact that these chances are not being converted raises questions about the strikers themselves. The fact that Christian Benteke has played just 625 minutes this season through injury and suspension has not helped matters, but now that he is back and playing well, might we see more of these chances being converted?

The return of Christian Benteke to full fitness should be a huge boost to Villa's attacking abilities

Interestingly, out of the three most attacking players (Agbonlahor, Weimann and Benteke), it is Christian Benteke that has required the most shots per goal this season. His two goals have come from 19 shots, while Andreas Weimann has required 6.0 shots per goal and Agbonlahor 5.67. Whether this reflects a difference in the type of shots that each player is taking (e.g. Benteke with more headed attempts) or whether it is just taking Benteke a few matches to fully get back up to speed remains to be seen.

The other major concern amongst the fans is a lack of creativity in the midfield. The lack of a traditional ‘number ten’ has been flagged up for many years now, but seems not to have been addressed yet.

A ‘key pass’ is a pass that leads to a shot on goal. If we look at Villa’s players this season, we can see that there are no players that really stand out as regularly creating chances. Of the regular starters, Ashley Westwood has the most key passes per 90 minutes with 1.06, followed by Charles N’Zogbia (0.85), Andreas Weimann (0.79) and Tom Cleverley (0.79). Joe Cole has been restricted to just 105 minutes this season due to injury, but his 4 key passes during that time (3.43 per 90 minutes) shows that he could have the potential to be the creative player that Villa desperately need, if only he is able to stay fit.

One player that has been missed in recent weeks is Fabian Delph. He has shown in the past year or so that he has developed into a very good midfield player. However, the aspect of his play that Villa have most missed in his absence is his ability to beat a man with the ball. His 2.59 successful dribbles per 90 is over double what any other Villa player has achieved this season and it is an important tool in terms of starting attacking moves. By taking it past a player, he is able to drive into space, commit other defenders and free up his teammates. Without him, it has been tough for Villa to create space for their attacking players simply by looking to pass the ball around.

While the midfielders may be very similar, they are all very comfortable on the ball. The top four players in terms of passes per 90 are Westwood, Sanchez, Cleverley and Delph, all with completion rates of over 80%. Slightly surprisingly, it is Ashley Westwood that has the lowest completion rate at 80.8%, although this could be due to the fact that he is the midfielder that most looks to play the cutting ball through the opposition defence. Tom Cleverley has been accused at times of playing the simple ball and not looking to create more, and it is Cleverley that has the highest completion rate at 87.3%.

Once again, Jores Okore shows up very favourably here. His pass completion rate of 86.4% is second only behind Tom Cleverley and his long ball completion rate is comfortably the highest of all the defenders.

The season started so promisingly for Aston Villa in defence. Three clean sheets in the opening four games suggested that the defensive problems of the past might be behind them. However, once the fixtures became tougher, some of the defensive frailties returned. Despite that, there are promising signs for the worst defence last season of the teams that avoided relegation. The table below shows some of the statistics:

Statistic
Value
Premier League Rank
Goals Against
20
8th
Total Shots Against
234
15th
Shots on Target Against
72
15th
Shots per Goal Against
11.7
4th
Shots on Target per Goal Against
3.6
                      3rd                                          
Clean Sheets
5
6th

We can see that Villa’s 20 goals conceded puts them 8thin terms of the best defences in the Premier League. The five clean sheets also puts them joint sixth overall. However, what is interesting is that Villa are 15th in terms of shots against and shots on target against. They are conceding plenty of shots, but for some reason, they are not conceding many goals. Let us look further at why this may be the case.

Using Michael Caley’s statistics from earlier, we can look into where the shots that Aston Villa have conceded have come from. We can see that 34.2% of the shots that Villa have faced have come from slow attacking moves, which should have the lowest conversion rates. This is the highest percentage of any team in the Premier League this season and helps to explain why teams seem to have such a poor conversion rate against Villa. Just 13.3% of shots come from fast attacks, which is the 7th lowest value in the Premier League this season. This is almost certainly a product of Villa’s style of play, which involves plenty of sitting deep and looking to break quickly. Against a team sitting deep and defending, it is tough for opposition teams to generate quick attacks.

One slightly worrying statistic though is that 40.0% of the shots that Villa have faced this season have come from inside the ‘danger zone’. This is the 6th highest in the Premier League, although if we combine this with the reasonably high proportion of shots in the danger area that are coming from crosses (52.3% - 2nd highest in the Premier League), it would seem that plenty of opposition chances are coming from headers from crosses being put into the box. If you are to concede chances in the danger area, it is probably preferable that these come from headers, rather than chances with the ball at the feet of an attacker. The 40.9% of shots against from outside the penalty area for Villa this season is 15th in the Premier League.

Combining all this information, it would seem that the chances that Villa are conceding this season are coming at the end of a slow passing move from the opposition, either from a cross into the box or from working the ball into a crowded penalty area and trying to get the shot off. This deep defensive tactic leads to plenty of chances being conceded, but not too many of those are clear cut chances for the opposition.

Let us now look at which players are most involved in defensive actions. The two obvious defensive actions that are recorded are tackles and interceptions. Both involve taking the ball off of the opposition team and recording a turnover of possession.

To begin with, let us combine the two actions in a single statistic – tackles and interceptions per 90 minutes (T&I/90). Matthew Lowton currently leads this for Villa with 5.48, followed by Jores Okore (4.83), Tom Cleverley (4.12), Alan Hutton (4.08) and Carlos Sanchez (3.73). In terms of the other defenders, we have Ciaran Clark (3.32), Aly Cissokho (2.94), Nathan Baker (2.80), Ron Vlaar (2.58) and Philippe Senderos (1.71). For the other midfielders, we have Ashley Westwood (2.71), Fabian Delph (2.24) and Kieron Richardson (1.56).

So, if we break this down, can we see differences in how players defend? Looking at the midfield, we can see that both Tom Cleverley (2.85 v 1.27) and Carlos Sanchez (2.16 v 1.57) show more tackles than interceptions, while Ashley Westwood (0.98 v 1.73) is the opposite. This would seem to fit in with the common perception that Westwood is the more intelligent footballers that is able to step in and intercept balls, but who maybe does not get stuck in as much as might be hoped in the middle of the pitch. Tom Cleverley’s 2.85 tackles per 90 is actually the highest of any Villa player this season, which shows a side of his game that might not have been immediately recognised – his ability to win the ball back and get stuck in.

Looking at the central defenders, all five of the players that have been used there this season show more interceptions than tackles. This makes sense given that it is a risk for players to go in for tackles when the opposition is closing on the penalty area. In midfield, you can take the risk of stepping in and trying to win the ball back as there are players behind you to cover. In defence, you often do not have that luxury. This also reflects that, given how deep Villa tend to defend, the midfielders are often required to do a lot of the tackling to keep the opposition at arm’s length, while the defenders are there to intercept any balls that are played in behind the midfield.

Jores Okore has been a revelation since he broke into the first team just over a month ago

Jores Okore’s 2.83 interceptions per 90 is currently the highest of any Villa player and, despite only playing six matches thus far, there are only three players that have made more interceptions in total. He has been excellent at reading the game and stepping up to block passes and win the ball back. His 2.00 tackles per 90 is also the highest of any of the central defenders showing how good he has been since he was thrown in due to injuries to Vlaar, Senderos and Baker.

Going forward, it is clear that the system this season is working relatively well in terms of limiting high-quality chances for the opposition, but that creating chances, and more importantly, converting those chances has been an issue. This season, Christian Benteke will be integral to this and, as he gets closer to full sharpness, this may well improve. In defence, Jores Okore is rapidly becoming Villa’s classiest defender and hanging onto him for as long as possible should be one of the top priorities in the coming years. His emergence should mean that the club can cope with the loss of Ron Vlaar in the summer, as Philippe Senderos and Nathan Baker are decent back-up players to the partnership of Clark and Okore, which has really blossomed in recent weeks.

If Joe Cole can stay fit, he could play a major role in creating chances for Benteke, but there is still a clear need for a creative midfielder to complement the solid foundation that Sanchez, Cleverley and Westwood can provide. Fabian Delph provides something different from those three, although it seems ever more likely that he will be departing the club at the end of the season.

The coming summer should be an interesting one for Aston Villa. With the reasonable likelihood that Christan Benteke, Ron Vlaar and Fabian Delph could all be departing, there will be considerable onus on Paul Lambert to use the available funds effectively. Thus far, he has rarely been given funds to spend, but when he has spent slightly more on players, it has been relatively successful. Christian Benteke has been an outstanding signing, while Carlos Sanchez and Jores Okore are looking to be very decent players. Aly Cissokho looks to be a solid defender for the price, while Libor Kozak was showing promising signs before his injury problems.

How any proceeds from the sale of Christian Benteke, plus any additional funds that may be made available now the club is in a more secure financial state, are spent this coming summer could shape the future of Aston Villa. Assuming Villa stay up this season, it has the potential to be a pivotal summer.

How To Fix a Tennis Match (by Denys Molchanov)

$
0
0
These days, Dallas is not exactly known as a tennis hotspot. It hosts a Challenger Tour event, but it rarely attracts much attention, particularly for a first round match between a Ukrainian and an Argentine. However, that is precisely where the attention of Twitter was focused on Monday evening.

The match in question was between Denys Molchanov and Agustin Velotti. For this article, we shall focus on Denys Molchanov, a Ukrainian ranked at 174 in the ATP rankings with career prize money of just over $310,000. The tournament in Dallas has prize money of $14,400 for the champion, but a first round defeat earns a player just $1,040.

Let us begin by looking at the pre-match markets. The image below shows the odds movements by Pinnacle, usually regarded as the most reliable bookmaker.


We can see that Denys Molchanov opened at 1.63 in the early hours of Monday morning. These odds give an implied probability of 61.3% of winning the match. As we can see, there was a slight drift on Molchanov as the day progressed, but nothing out of the ordinary. When the market closed at 19:56 on Monday evening, Molchanov was 1.77 to win or 56.5%. Nothing unusual here.

The first concern was raised in a tennis chatroom with someone questioning why Molchanov was as big as 2.36 and why the market appeared not to be moving. When Denys Molchanov clinched the first break and Agustin Velotti's price continued to shorten, further questions began to be asked. At 5-3 down in the opening set, the price on Agustin Velotti was as short as it had been throughout the entire match.

Despite being broken serving for the set, Molchanov immediately broke back and with the second chance to serve for the set, the price on Agustin Velotti continued to fall. Having been priced as 48.3% chance to win the match at the start, he was now priced as a 75.2% chance of winning the match, despite being down a break and potentially about to lose the opening set of the match. In other words, Velotti was apparently significantly more likely to win the match at this point than he was at the start.

Denys Molchanov successful served out the opening set and Velotti's price continued to drop. Now, you do not need any understanding of betting and odds to understand that a player that was given a 48.3% chance of winning a tennis match before the start should not be given a 80.6% chance of winning a match at a set down, unless there is something suspicious going on.


The end of the first set also saw a significantly amount of money hit the market as pointed out in this tweet:


By this time, there was already close to £250k staked on the match - a surprisingly high amount for a Challenger match. We can see as well that Agustin Velotti had already been matched at 1.09 or a 91.7% chance of winning the match, despite starting the match as the outsider and never having been ahead in the match.


A hold of serve later and the money continued to pile in on Agustin Velotti. He was now 93.5% to win the match, despite being down a set. Under normal circumstances, we would expect Velotti to have roughly about a 20% chance of winning the match from this point. We can also see that there is money looking to back Velotti at 1.5 to win the second set.


Agustin Velotti went up a break in the second set and by this time, there was little doubt as to what was happening.  The prices in the market were no longer reflecting anything to do with what was happening in the match. We can see the money lining up in the market on Velotti and we can also see that his price is exactly the same as it was after the opening hold in the set. One might suggest that someone already knew that the break would happen. In fact, one might suggest that someone knew precisely how the match would end.


Agustin Velotti went on to win the second set and after a brief pretense at putting up a fight in the opening stages of the third set, Molchanov duly gave up a break in the third. By this point, Velotti was guaranteed to win according to the market. The farcical nature of what the match had become was perfectly summed up in this glorious point.


There was little effort from Molchanov to get back into the match, as demonstrated by the fact that he won just five points on the Velotti serve in the final set, one of which came through a Velotti double fault.

By the end of the match, there was close to £600k matched on the Betfair match winner market - a large amount for a Challenger match. Indeed, it was more money matched than on the infamous Antal van der Duim and Boy Westerhof match last year (article here).

Agustin Velotti had begun the match as the outsider, but had steadily shortened in the markets, independently of what was actually taking place in the match itself. It was as though someone knew from the very start that there was no chance of Denys Molchanov winning the match.

Now, I should stress that there appears to be no suggestion that Agustin Velotti had anything to do with any of the suspicious odds movements that took place in this match. He appeared to be playing his match normally, acting normally, although there were suggestions that he looked a little confused as the match progressed. People watching the live stream of the match reported that there was a number of very strange errors being made by Molchanov off very simple shots and it is understandable that Velotti might have been puzzled by what was happening to his opponent.

However, it is tough not to suspect Denys Molchanov in this situation. The odds movements in the match simply cannot be explained. With a narrow favourite, that player becoming a slight outsider as the opening set progressed is plausible depending on how the players were performing. However, a narrow favourite becoming a huge outsider while ahead in the set and having won the opening set is simply not possible.

On Betfair, the only possible scenario in which these odds movements might happen was if there was a major injury to Molchanov and the market expected an imminent retirement. However, this simply was not the case. The only hint of any possible injury was Molchanov clutching his leg during the second set, but there was no indication of any serious injury and the odds were already way out of line long before this.


The link above shows the full match for anyone that may be interested in following the action. Now that we have shown the odds movements for this match, you can see whether there was anything in the match to suggest that the strange movements may have been justified.

Despite all the evidence in the markets, chances are that nothing will be done. The infamous Meersbusch match last year has so far led to nothing and there is not even any indication that the match is being investigated. However, all we can do is to flag up these matches in the hopes that eventually something might be done.

To finish, I will simply copy and paste the final paragraph from my previous article on this topic. It felt relevant then and it seems just as pertinent now.
If no action or investigation is launched, many fans will lose what little faith remains in the authorities to combat the growing spectre of match-fixing in the sport. For the ATP and the TIU, the ball is now in their court. Do they have a response?

UPDATE

There is now an interview with Agustin Velotti where he is asked whether he had any suspicions about the match. He emphasises that he played no part in any questionable activities involving the match. I agree with him in that there did not appear to be any suspicion surrounding his involvement in any potential fix in this match. As far as I am concerned, he would appear to be an innocent bystander that was caught up in this.

The full interview with Agustin Velotti, conducted by Raul de Kemmeter is available here.

Spotlight on Jimmy Wang

$
0
0
If you asked someone what linked the tropical Hawaiian island of Maui and the South-Central Mexican state of Morelos, chances are you would get rather more peculiar looks than you would get answers. For the vast majority of people, there is no link between them. For avid lower-level tennis fans, they might mention that both play host to an event on the Challenger Tour. However, for one particular player, the two tournaments might be somewhat more memorable.

That player is the current world #128, Jimmy Wang. A former junior number three and finalist at both the Australian Open and US Open junior tournaments, the Taiwanese number two has career earnings of a fraction over $1,000,000 in a career stretching back almost fifteen years. However, in both Maui and Morelos, there have been major concerns surrounding highly suspicious betting patterns on his matches.


Whilst the two matches are both highly suspicious, the actual nature of the potential fix is different in the two cases and it provides an interesting insight as to different ways of profiting from a potentially fixed match and possibly as to the progressing of the style of fixing.

The first match I will look at was played back on the 22ndJanuary, 2014 from the Hawaiian island of Maui. The match saw Jimmy Wang, ranked 173 at the time, and having just come off the back of qualifying for the Australian Open playing against one of America’s most talented college players, Jarmere Jenkins, ranked 342, who had only made it into the main draw as a lucky loser having lost in qualifying.

At 7:11am in the UK, Pinnacle had opened up the match for betting with Jimmy Wang as the 1.50 favourite and Jarmere Jenkins at 2.64. In other words, Jimmy Wang had been given a 66.7% chance of winning the match with Jenkins being given a 37.9% chance. A potentially close match, but one in which Jimmy Wang was certainly rated as the favourite.


By 8:00pm when the match was taken down, there had been a strong shift in the odds. Jimmy Wang’s odds had drifted way out to 3.00, while Jarmere Jenkins was now the 1.40 favourite. Having had a 66.7% chance of winning the match in the morning, Jimmy Wang’s chances were now down to 33.3% while Jarmere Jenkins was now 71.4% to win the match. The initial odds may well have been slightly wrong – American college players are often underrated by the market – but it seems unlikely that the odds were that wrong.


Looking at the Betfair historical data for that match also raises several flags. Across the four markets that Betfair offers (Match Winner, Set Betting, Set 1 Winner and Set 2 Winner), there was £19,625.61 matched. The majority of Challenger matches would expect to see up to around £2,000 matched. The table below was compiled for a different article, but represents the amounts matched pre-match on first round matches from the Tampere Challenger last year.


As we can see, the amount matched on this Wang Jenkins match is unusually high. Almost £14,000 of this was matched on Jarmere Jenkins in the match winner market at odds ranging from 2.84 down to 1.31. Interestingly, there were only 163 individual bets matched to cover all of that money, suggesting that fairly large amounts were being staked in individual bets.

During the actual match itself, Jarmere Jenkins was never matched above 1.83 and over £65,000 was matched on Jarmere Jenkins with less than £5,000 being matched on Jimmy Wang. Jimmy Wang never created a break point in the match and was able to win just 11 points on the Jenkins serve throughout the entire match.

Could it be that there was nothing suspicious and Jarmere Jenkins was simply a deserving favourite? As one of America’s top college players, maybe he did have the potential to be a top player and someone simply recognised that and decided to back up their views with a large amount of money. Possible, although the fact that a year on, Jarmere Jenkins is still ranked at 191 suggests that maybe that is rather unlikely.

It is noticeable here that there was a huge amount staked pre-match causing big moves in the odds. While there was a reasonable amount matched in-running, big money was put down before the event.

Jumping forward to today, Jimmy Wang was once again in action. This time, the location was the city of Cuernavaca in the Mexican state of Morelos. The opponent was Giovanni Lapentti, a former world #110 and a career journeyman on the Challenger Tour.

At 7:16am this morning, the Pinnacle odds on Giovanni Lapentti to win the match were 2.85 with Jimmy Wang at 1.43. In other words, Jimmy Wang had a 69.9% chance of winning the match and Lapentti had a 35.1% chance. Throughout most of the day, there was little movement in the odds. However, there was a very peculiar movement at 3:57pm, just three minutes before the match was scheduled to begin. In one single move, the odds on Giovanni Lapentti were slashed from 2.72 into 1.99 – a change from a 36.8% chance to a 50.3% chance. While it takes less money to move a Challenger market with Pinnacle than an ATP market, it would still have required a large sum to move it that much in one single jump. By 4:00pm, it had moved back out to 2.35 presumably as traders and bots recognised an incorrect price and moved it back out to a more realistic price.


In itself, that is not a massive red flag. It is unusual to get a move of that magnitude, but there are big punters out there on tennis. However, the betting patterns during the match itself add weight to our suspicions.

There was also an interesting plunge in the odds on Giovanni Lapentti on Betfair in the run-up to the match. The volume bars at the bottom give us an idea when the match started - there is generally a pick-up of volume once a match actually begins. We can see that from a peak of almost 3.75, Giovanni Lapentti shortened significantly to around 2.25, before a huge drop following an early break of serve. Despite Wang breaking back and actually going ahead a break, we can see that Lapentti barely even returned back to his pre-match price, even whilst a break down in the first set.


The first mention of suspicions on this match came from @TennisPurist on Twitter:
As we can see, at 5-5, *15-30, Giovanni Lapentti is now the 1.22 favourite to win the match and 1.03 to win the first set. This is pretty unlikely given the starting prices in the match. Even if we take the starting Pinnacle odds, which had already been moved by the large bet on Lapentti, Jimmy Wang was 1.61 to win the match at the start. It seems unlikely under any situation that he would now be 5.0 to win the match - a move from 62.1% to 20.0% - simply from being 15-30 down on his serve at 5-5.

One might be able to make a case had Wang gone well ahead in the match before Lapentti made a dramatic comeback. While Jimmy Wang had been 4-2 ahead, the previous three games had all been holds of serve, so there was no major momentum effects at play.


Jimmy Wang was broken in this game and Lapentti served out the set. Another flag here was the amount that was matched on Giovanni Lapentti to win the first set. The set winner markets are generally pretty low liquidity on Betfair, so to see almost £14,000 matched on the market with the vast majority on Lapentti is concerning, especially with reasonable large amounts matched between 1.40 and 1.60. We cannot simply put this down to money buyers inflating the matched figure at short odds.

At the end of the first set, Giovanni Lapentti was into 1.10 to win the match. The same possible reasons for this price apply here as it did in the Denys Molchanov match (as explained here). Realistically, the only possible reason for a price like this given the circumstances was an imminent retirement through injury.

There had been no signs of an injury at this stage, although Wang did call a medical timeout at 0-1* down in the second set. By this point, the market was fully convinced that Lapentti would go on to win and there was virtually no move at Wang getting a break back at 3-0 down. By the end of the match, there was £151,819 matched on the match winner market with the vast majority of Giovanni Lapentti.


Again, is there definite proof that the match was fixed? No. Are there strong suspicions surrounding the questionable betting patterns on this match? Absolutely. Maybe Wang was ill or more injured than he let on. If this was the case, then while the match may not have been fixed, someone was certainly passed the information before the match had started.

Each of these two matches showed suspicious odds movements that corresponded with the actual outcome of the match. On their own, they would both have raised red flags. Taken as a pair involving the same player, serious questions must be asked.

Whether those questions will be asked remain to be seen. There was a decent response from tennis journalists on Twitter in the wake of the suspicious betting patterns on the Molchanov match. However, if the ATP and TIU are not going to show any indications that they intend to seriously tackle the problem of match fixing, it is down to these journalists to ask the difficult questions.

There are people such as myself and many others on Twitter who pay close attention and trade these markets and are very capable of spotting suspicious betting patterns. However, we do not have access to players and officials to ask questions and too many times, we are fobbed off by claims that we have lost bets and are simply bitter and looking for excuses. Alternatively, people simply suggest that betting should be stopped on lower levels of tennis. Put simply, this is just not going to happen. It is a lazy suggestion and does nothing to tackle the problem of match-fixing - betting would still happen on these events, but it would just be forced into the illegal markets where it would be impossible to track.

Instead, the authorities need to target those players and associates that are involved in match fixing. And if the authorities are not going to do it, it needs journalists to question those in authority. We saw in cycling how it was journalists that eventually blew the lid on the Lance Armstrong doping situation. Is there a serious respected tennis journalist that is willing to ask the right questions to the right people?

Competitive Balance in the Premier League

$
0
0
‘Among us, no one shall be the best; but if someone is, then let him be elsewhere and among others. Why should one be the best? Because then the contest would come to an end and the eternal life for the Hellenic state would be endangered’

This quote shows that competitive balance has been crucial for 2,500 years. Made following the ostracism of Hermodorus, it describes how ancient Ephresians exiled any competitor in a contest who they felt was too dominant, preserving interest in the contest.

The issue of competitive balance has often been brought up with regards to the Premier League. The money involved, particularly through participation in the Champions League, has been accused of making the Premier League relatively uncompetitive, and as a result, slightly boring at times. The same teams tend to dominate at the top of the league and the same teams struggle season after season to hang onto their treasured place in the division.
Fans always hope their team can progress up the league - uncertainty as to
results is the driving interest in sport

So, has the competitive nature of the Premier League declined since its inception due to the growing gap between itself and the Championship? Has it declined within the league as the Champions League clubs move ahead into their own virtual mini-league?

First of all, let us clarify what we mean by competitive balance. If there is considerable uncertainty concerning the outcome of a sporting contest or league competition, we would say there is high competitive balance. It is a relative measure of sporting abilities across teams in competitions.

There are two types of competitive balance. Static competitive balance looks at within-season competitive nature of a league. It focuses on whether sides are evenly matched, leading to closely-fought tournaments or whether there are large differences, leading to runaway leaders and sides adrift at the bottom. Dynamic competitive balance looks at competition over longer periods, focussing on whether sides consistently occupy the same positions in the league.

So, how can we measure competitive balance? We shall borrow two methods from economics – the Null-Scully value and the Spearman Rank Coefficient.

The Noll-Scully measure compares the standard deviations of winning percentages in the league with the standard deviations we would expect in a perfectly competitive league, where every side has a 50% chance of defeating any other side. We then derive the Noll-Scully value using the formula:
where σ(wp)ideal is equal to 0.5/√N. σ(wp)it represents the standard deviation of winning percentages within league i during period t, and N represents the number of games. The standard deviation of an ideal season takes this form because the standard deviation of a random selection of an individual team’s wins follows a binomial distribution (N,p) where N is the number of games played and p is the probability of winning. In a perfectly competitive league, p would be 0.5; hence we get the expression for the standard deviation in a perfectly competitive league.

In a perfectly competitive league, the Noll-Scully value would be one, since the two standard deviations would be equal. This value must always be greater than one, since the standard deviation in any competition cannot be lower than that in a perfectly competitive league. The closer to one, the more competitive the league.

The measure for dynamic competitive balance is the Spearman rank correlation coefficient. This looks at correlation between finishing positions of clubs in consecutive seasons. In a perfectly competitive league, there should be no correlation between where clubs finish in one season and where they finish in the following season. As the league gets less competitive, the Spearman value moves further from zero, either positively or negatively. In many cases, teams that do well in one season do better the following season, so we would expect it to become more positive.

To calculate the Spearman coefficient, we must rank the teams. Fortunately, the structure of league competitions does this. The team that finishes top has a ranking of 1; the second-placed team has 2, and so on. We then use the formula:
where di is the difference in rank for team i between the current season and the previous season, and n is the number of teams. In a perfectly uncompetitive league, every side will finish in the same position as the previous year, d will equal zero, and therefore the Spearman’s coefficient will be 1. As it becomes more competitive, this moves toward zero.

Obviously, the Premier League has a relegation system, where the bottom three clubs are demoted to the Championship, while three teams are promoted into the league to take their place. To deal with this across seasons, the team that wins the Championship will be treated as equal to the team that finished 18th in the Premier League, the team that finished 2nd would correspond to the Premier League's 19th placed team, while the Playoff winner will correspond to the bottom team in the Premier League.

Now that we have established our two measures, let us look at how they have changed over the past 22 years since the Premier League began. The first chart below shows the Noll-Scully values:
As I stated earlier, a perfectly competitive league would have a Noll-Scully value of 0.5. Clearly the Premier League is far from a perfectly competitive league, but every league in every sport in the world has certainly levels of imbalance.

However, we can see a steady upward trend in the Noll-Scully value since the inception of the Premier League in 1992. The first season saw a N-S value of 1.04, but ever since then, it has followed a relatively constant increase with the exception of the 2010/11 season, which saw a surprisingly low value.

So, the 2013/14 season that recently finished saw a N-S value of 1.99, but how does this compare with other competitions? In the National Hockey League (NHL) in America, the average N-S value during the 2000s was 1.73. For the National Football League (NFL), we find a value of 1.57, while the National Basketball Association (NBA), the value is just below 3.0.

We can conclude that the English Premier League has a greater static competitive balance than the NBA, but less than both the NHL and NFL. The concern might be the trend in the static competitive balance though.

How does the Premier League perform on dynamic competitive balance? The chart below shows the Spearman rank coefficient:
As stated earlier, a perfectly dynamically competitive league would have a Spearman value of 0. A perfectly uncompetitive league where every team always finishes in the same position would have a value of 1.

We can see that the Spearman coefficient dramatically increased in the years immediately following the inception of the Premier League. The drop following the 1999/2000 season marks the point where the number of English teams in the Champions League increased from two to three, then four. There was slightly more competition around this period as additional teams gained the opportunity to benefit from the riches of the Champions League, but once the Big 4 teams were established, the Spearman coefficient returned to its upward trajectory.

It is too soon to draw any clear conclusions, but the drop in the Spearman coefficient this season might be linked to the increased television money in the Premier League increasing competitive balance within the league as other teams can afford transfer fees to bring in new stars, but it could just as easily be dominated by the effect of Manchester United dropping from 1st to 7th following the departure of Sir Alex Ferguson and Liverpool's unexpected title challenge. The coming seasons should help us to understand this more.

Again, how does this compare with other competitions? In the NHL, the Spearman value tends to fluctuate between 0.4 and 0.6, in the NFL, it is between 0.2 and 0.3 and in the NBA, it is around 0.6.
The NFL is one of the most competitive competitions in global sport

Thus, the Premier League has incredibly high levels of dynamic competitive imbalance. Teams tend to finish in the same position from season-to-season with very little real change. There may be some variety in terms of how far apart all the teams in the division are, but in terms of where they actually finish, there is very little difference.

This roughly corresponds with what we expected to find. The top teams are financially far superior to the rest of the league, meaning that they rarely drop out of the top grouping. Even within that top group, there is a fairly strong pecking order. For the majority of recent seasons, Manchester City, Manchester United and Chelsea have battled for the title. Arsenal have finished 4th, while Tottenham, Liverpool and Everton battle it out for the 5th-7th placings.

The growing gap financially between the Premier League and the Championship means that teams often struggle when they come into the league, while the same group of teams tend to either just stay up or finish in a comfortable mid-table position come the end of the season.

This is where the Premier League may struggle in the future. The steady rise in the Noll-Scully value shows that the gap between the top and bottom of the league is growing almost year-on-year, which combined with the Spearman coefficient, means that the league is becoming more and more hierarchical. If this continues, people will start to lose interest in the league. Fans always maintain that hope that their club can break into the higher levels over time. If this hope is diminished, the interest in watching the sport might begin to decline.
Michel Platini's FFP regulations will have a negative impact on competitive balance

Is there hope that things might change? Sadly, it would appear not. The new UEFA Financial Fair Play regulations will act to reduce competitive balance further by artificially imposing different budgets on teams. The top teams already have greater revenues, so they can spend more money. Smaller clubs will no longer be able to speculate to accumulate.

Without more considered interference from either the Premier League or from UEFA, it is tough to see how these trends can be halted or even reversed. The financial aspect of football means that the top clubs get richer and richer at a far higher rate than the rest of the league. Thus, it is likely that competitive balance will continue to fall over the coming years.

Looking at Tiebreak Performance

$
0
0
We can all picture the scene. A tennis match goes into a tiebreak and whether it is via the commentators or via a graphic, we are informed that one player is 6-4 in tiebreaks this year while his opponent is 4-6 during the same period. As a result, we are informed that the former is clearly the favourite for the tiebreak.

At the most basic level, a player's win-loss record in tiebreaks over a given period of time is the obvious place to begin when we are looking to quantify how good a player performs in tiebreaks. However, as with virtually every tennis statistic, it fails to do anything more than scratch the surface in terms of improving our understanding of how good players really are in tiebreaks.
John Isner is often mentioned among the best tiebreak players in tennis

Consider the following examples. Milos Raonic plays 100 tiebreaks against Yan Sabanin, the current world #1000. He wins sixty of those tiebreaks and loses the other forty, giving him a tiebreak record of 60-40. At the same time, Robin Haase plays 100 tiebreaks against the current world #1, Novak Djokovic. He wins forty of those tiebreaks, but loses the other sixty, giving him a tiebreak record of 40-60. Now, simply using the basic W-L records for Milos Raonic and Robin Haase, we would suggest that Raonic is clearly the better tiebreak player. However, in reality, we would have expected him to win far more than sixty of the tiebreaks. Let us assume that we would expect him to win ninety of the tiebreaks. Based on this, we could say that Raonic has actually won thirty fewer than we would expect. At the same time, maybe we expected Robin Haase to win thirty of the tiebreaks against Djokovic. Thus, he actually won ten tiebreaks more than we expected. Would we still claim that Raonic is the better tiebreak player?

This is the basis of the analysis that I have done to look deeper into which players overperform our expectations in tiebreaks and which players underperform.

First, the slightly boring part - a brief overview of the methodology and data. Using data for every ATP and Grand Slam main draw between the start of the 2010 season and the end of Indian Wells 2015 from Tennis-Data, I compiled the actual tiebreak record for every player that has played a main draw match in that period.

Using the Pinnacle closing price for each of these matches, I calculated probabilities for each player winning each tiebreak that they played during the period. Match probabilities can be calculated from projected service hold percentages - each combination or ratio of service hold percentages corresponds to a particular match probability. Working back from these match probabilities can generate average service hold percentages, which can then be used to generate probabilities for the tiebreaks in that match. Obviously the actual tiebreak probabilities may have been slightly different based on various momenta and situations in the match, but over a large enough sample, this should be negligible.

Once we have tiebreak probabilities for each tiebreak, we can sum these up for each player to generate expected tiebreak win-loss records. This is what we would expect that player's record to be if he were a perfectly average tiebreak player at that player's overall level. By comparing the expected wins to the actual wins, we can see which players out-performed expectations and which players failed to meet expectations.

Due to small sample sizes for some players, I decided to exclude any player that had played fewer than 30 tiebreaks during the five and a bit year period that the data covers.

So, which players are the best tiebreak players?

John Isner is a name often mentioned when it comes to determining top tiebreak players. His 180-97 (65.0%) record stands up to the best of them. Our new method backs up this claim. He would have been expected to win 153.3 of the 277 tiebreaks that he played during this period, so he actually won 26.7 tiebreaks more than we would have expected, which translates to 14.8% more than expected.

Novak Djokovic also has a strong winning record in tiebreaks with a 74-50 (59.7%) record. However, we could postulate that he would have been a reasonable favourite to win the majority of those tiebreaks. The new method backs this up - we would expect him to win 82.5 of the 124 tiebreaks. So, he actually won 8.5 tiebreaks fewer than we would have expected, which translates to 11.4% fewer than expected. So, despite his strong winning record, we could suggest that Novak Djokovic actually performs less well in tiebreaks than we would expect him to do, given his overall level of play.

In fact, all of the Big 4 tend to fall short of expectations in tiebreaks. Rafael Nadal wins 4.4% fewer than expected, Andy Murray is 5.3% fewer, while Roger Federer wins 6.6% fewer than expected. Kei Nishikori is a player to keep onside in tiebreaks, outperforming the expected wins by 7.0%, while Milos Raonic outperforms by 9.2%.

That covers a number of the big names, but which players are actually the biggest overperformers and which players really should be avoided in tiebreaks?

The top 10 names feature some that might be expected and some that will probably come as a surprise to many. The table below shows the top 10 tiebreak performers:

Steve Darcis has an exceptional tiebreak record. Given we would expect him to have had a losing record, a 23-7 actual record is quite astonishing. Tiebreak wins over the likes of Rafael Nadal, Andy Roddick, Nikolay Davydenko and Stan Wawrinka are all outstanding wins for a player of the level of Steve Darcis.

There are also a number of names on the list that might stand out to those that have looked deeper into tennis statistics. The likes of Nick Kyrgios, Fabio Fognini and Joao Sousa are all players that generally seem to achieve results that are beyond what many of their serve and return statistics would suggest that they should. Their presence at the top of the tiebreak list might help to shed some light on this - they win far more tight sets than one would expect them to win. For a player such as Fabio Fognini, who is hardly known for his mental strength, his presence here might surprise many.

We have seen the top tiebreak players, but who are the worst. The table below shows the bottom ten in the overall list:

It will come as no surprise to any tennis fans to see Robin Haase bottom of this list. Given we would expect him to have a record close to 50%, his actual record of 27-60 (31.0%) is quite frankly awful. In terms of perceived mental strength, the presence of the French pair of Edouard Roger-Vasselin and Paul-Henri Mathieu is hardly a surprise either. One might suggest some form of suspicion at the presence of the trio of Russian players at the bottom of this list, but that is for another day.

This new method of analysing a player's ability in a tiebreak is still far from perfect. However, I would suggest that it gives a better impression of how players perform in this particular situation than their simple tiebreak win-loss record.
Viewing all 157 articles
Browse latest View live